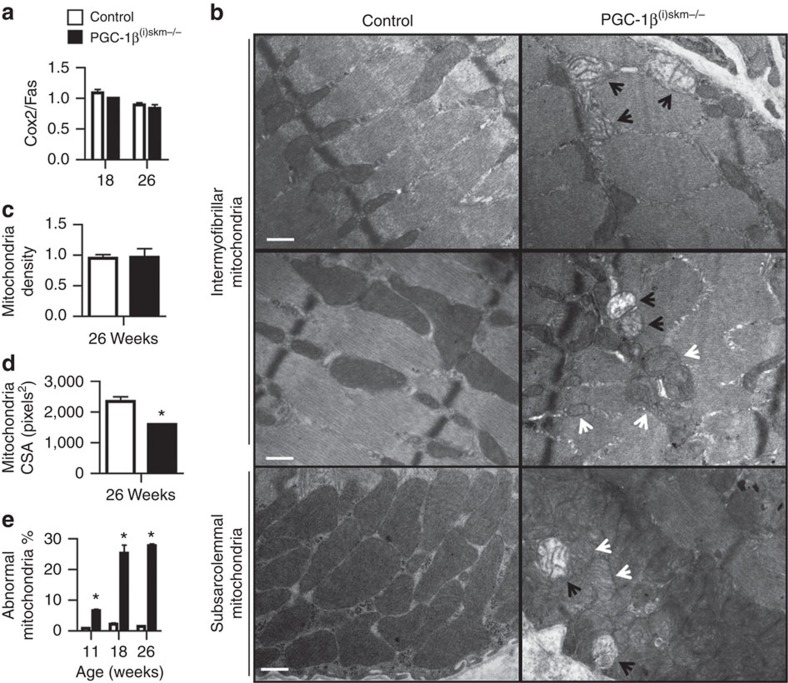
Figure 3. Characterization of mitochondria in PGC-1β(i)skm−/− muscle.
(a) Mitochondrial DNA content determined on gastrocnemius muscle DNA from 18 and 26-week-old control and PGC-1β(i)skm−/− mice by quantitative PCR analysis using primers for COX2 (mitochondrial gene) and FAS (nuclear gene) (n=18). (b) Representative electron micrographs of gastrocnemius muscle from 26-week-old control and PGC-1β(i)skm−/− mice. Black arrows indicate mitochondria with disrupted cristae and white arrows indicate decreased cristae matrix density. Scale bars, 1 μm. (n=3). (c) Mitochondrial density per μm2 of fiber cross-section in gastrocnemius muscle of 26-week-old control and PGC-1β(i)skm−/− mice determined on electron micrographs (n=3). (d) Mitochondria CSA in gastrocnemius muscle of 26-week-old control and PGC-1β(i)skm−/− mice (n=5) evaluated on electron micrographs. (e) Quantification of abnormal mitochondria on electron micrographs of gastrocnemius muscle from 11, 18 and 26-week-old control and PGC-1β(i)skm−/− mice (n=3). Data are represented as mean±s.e.m. *P<0.05, Student's t-test.

