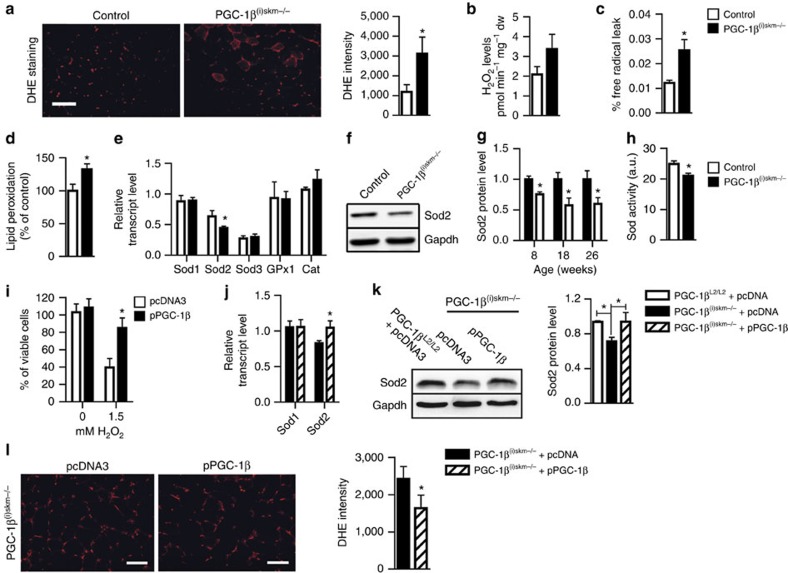
Figure 7. Oxidative stress in muscles of sedentary PGC-1β(i)skm−/− mice.
(a) DHE staining of gastrocnemius muscle sections from 26-week-old sedentary control and PGC-1β(i)skm−/− mice (left panel), and staining intensity quantification (right panel; n=9). (b) H2O2 levels determined by Amplex Red, in gastrocnemius muscle of 26-week-old sedentary control and PGC-1β(i)skm−/− mice (n=9). (c) Free-radical leak determined on saponin-skinned gastrocnemius fibers of 26-week-old sedentary control and PGC-1β(i)skm−/− mice (n=9). (d) Lipid peroxidation, determined by Thiobarbituric Acid Reactive Substances Assay, in gastrocnemius muscle of 26-week-old sedentary control and PGC-1β(i)skm−/− mice (n=9). (e) Relative transcript levels, determined by RT-qPCR, of Sod 1, 2, 3, Gpx1 and catalase (Cat) in gastrocnemius muscle of 26-week-old sedentary control and PGC-1β(i)skm−/− mice (n=8). (f) Representative western blot analysis of Sod2 from quadriceps muscle of 18-week-old control and PGC-1β(i)skm−/− mice. Gapdh is used as the internal control. (g) Relative Sod2 protein levels in quadriceps muscle of 8, 18 and 26-week-old PGC-1β(i)skm−/− mice and control mice. Gapdh is used as the internal control (n=6). (h) Sod activity, determined by a colorimetric reaction, in tibialis anterior muscle of 18-week-old PGC-1β(i)skm−/− and control mice (n=4). (i) Viability of C2C12 myotubes transfected with an empty vector (pcDNA3) or a plasmid encoding PGC-1β (pPGC-1β) and cultured 6 h in absence or in presence of 1.5 mM H2O2, determined by trypan blue exclusion (n=4). (j) Relative transcript levels, determined by RT-qPCR, of Sod1 and 2 in gastrocnemius muscle of 26-week-old PGC-1β(i)skm−/− mice, 7 days after electroporation with pcDNA3 or pPGC-1β (n=4). (k) Representative western blot analysis of Sod2 in tibialis anterior muscle of 26-week-old control mice electroporated with pcDNA3, and PGC-1β(i)skm−/− mice electroporated with pcDNA3 or pPGC-1β (left) and average fold-change (right). Gapdh is used as the internal control. (n=4). (l) DHE staining of gastrocnemius section from 18-week-old PGC-1β(i)skm−/− mice electroporated with pcDNA3 or pPGC-1β (left panel), and staining intensity quantification (right panel; n=4). Scale bars, 100 μm. Data are represented as mean±s.e.m. *P<0.05, Student's t-test.

