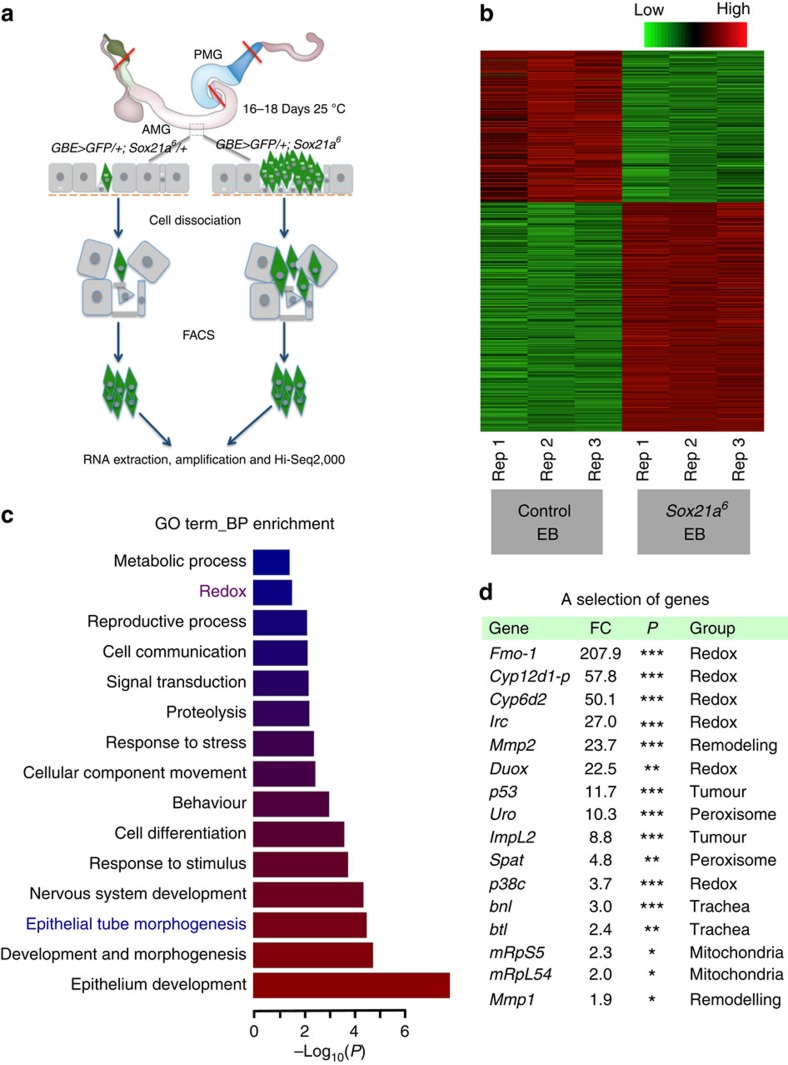
Figure 5. EB-specific transcriptomics.
(a), Transcriptional profiling of Sox21a/+ (control) and Sox21a EBs by RNA-seq was performed with messenger RNA isolated from FACS-sorted EBs based on the presence of GBE>GFP fluorescent signal (see Method part for details). (b) Clustering of 1,080 differentially expressed genes (P<0.05, Robinson and Smyth exact test) between Sox21a/+ and Sox21a EBs revealed that biological repeats (triplicates) cluster together. Columns correspond to replicate and rows to different genes. Relative expression level is indicated by the colour key shown at the top. (c) The 1,080 genes with differential expression were classified based on their gene ontology (GO) terms for biological process (BP). Enrichment of each GO term is shown with the P value. Red terms are the most significantly enriched ones. Redox and epithelial tube morphogenesis, described afterwards in the paper, are in red and blue, respectively. (d) A selection of genes upregulated in Sox21a EBs. Fold change (FC), the range of P values (*<0.05; **<0.01; ***<0.001) and the gene function groups are shown.

