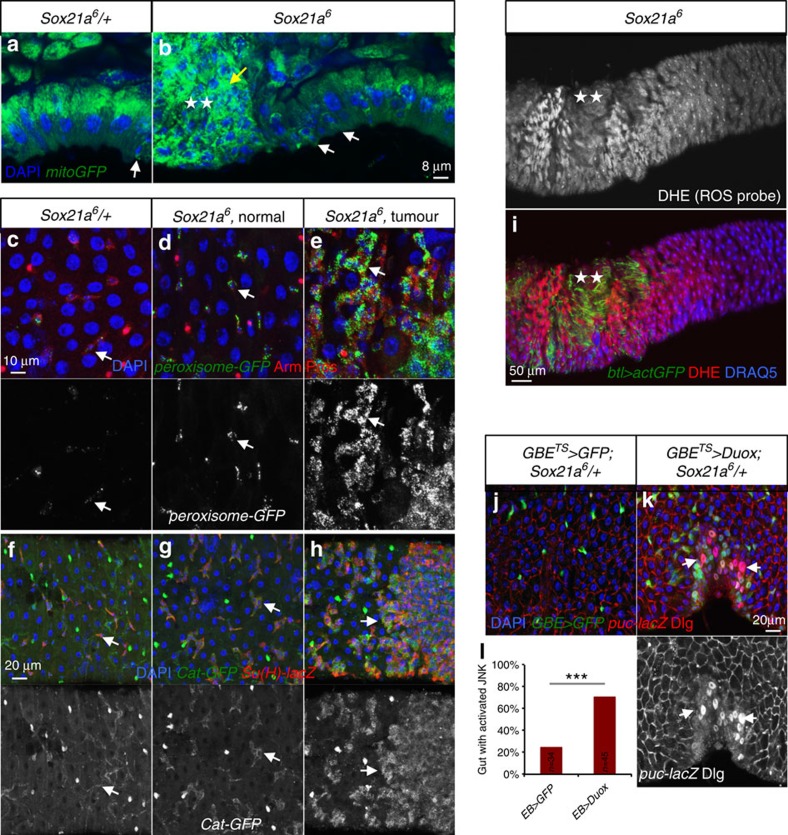
Figure 8. Increase of ROS at the border of Sox21a tumours.
(a,b) Confocal sections of 2-week-old Sox21a/+ (control, a) and Sox21a (b) intestine expressing the mitochondrial-targeting GFP (mitoGFP, green) driven by Act5C-Gal4. While mitoGFP signals are found in progenitors of wild-type and Sox21a flies (white arrows in a and b), a higher level of mitochondrial signal (yellow arrow in b) was observed at the site of Sox21a tumour (indicated with two stars). (c–e,f–h) Two-week-old Sox21a/+ (control, c,f) and Sox21a (d,e,g,h) intestine either expressing a GFP fusion protein targeting the peroxisome (peroxisome-GFP, green) driven by Act5C-Gal4 (c–e) or a Catalase (Cat)-GFP protein trap (f–h). Shown are regions from the AMG of Sox21a flies without (d,g) or with tumour (e,h). Signals corresponding to peroxisomes and Cat are both enriched in progenitor cells of Sox21a flies (Sox21a6, normal) compared with control flies (Sox21a6/+), and are further enhanced in Sox21a tumour sites (Sox21a6, tumour; indicated by arrows). Progenitors are marked by Arm (red, plasma membrane) in c–e. EBs are marked by Su(H)-lacZ in f–h. (i) ROS distribution in Sox21a intestine as revealed by dihydroethidium (DHE) staining of unfixed tissue. Cells are visualized by the live-cell DNA-dye DRAQ5 (blue) and tumour by the expression of btl>actGFP (green, indicated by two stars). (j–l) Representative images (j,k) and quantification (l) of puc-lacZ expression in Sox21a/+ flies either expressing GFP (control, j,l) or Duox (k,l) in EBs for 10 days at 29 °C. Examples of enterocyte with activated JNK signalling are indicated by arrows (k). Numbers of flies scored for each genotype (in biological triplicates) are indicated in l. P values from χ2-test (*P<0.05; **P<0.01; ***P<0.001). Each individual image shown in a–k represents 12 flies tested in one experiment (in three biological replicates).

