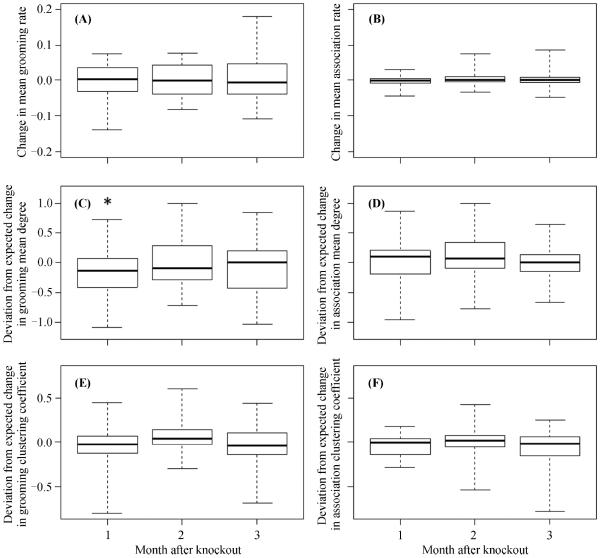
Fig. 1. Knockouts of alpha and beta males had small or no effects on adult female baboon grooming and association dynamics.
Graphs A, C, and E show effects on grooming: (A) mean grooming rate, (C) network mean degree, and (E) global clustering coefficient. Only mean grooming degree in the first month after knockouts showed a significant decrease in a Wilcoxon test (C). Graphs B, D, and F show effects on association: (B) mean association rate, (D) network mean degree, and (F) global clustering coefficient. Box plots indicate maximum, 75% percentile, median, 25% percentile, and minimum of recorded values.

