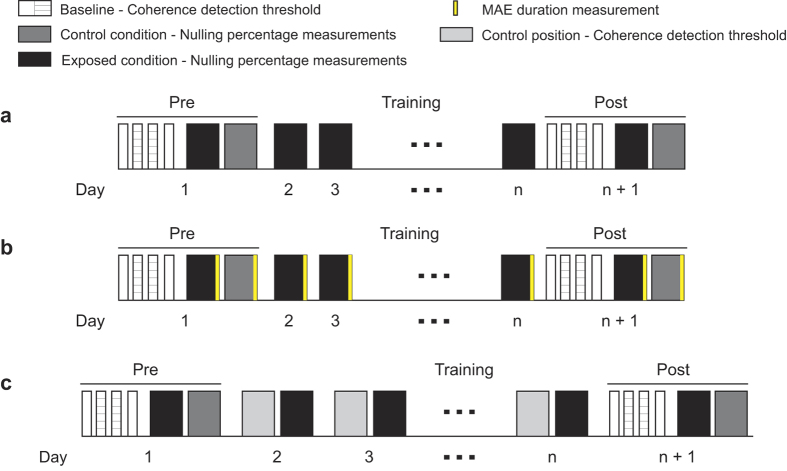
Figure 1. Flowcharts for the motion adaptation experiments.
. (a) The experimental protocol in Experiments 1.1 and 1.2. Four sessions were first completed to measure coherence detection thresholds at both the exposed (striped bars) and control locations (white bars) in the pre- and post-tests. The sequence was counter-balanced across the subjects. Then nulling percentages were measured under top-up adaptation. This was done by measuring the nulling percentages for adaptation to upward motion at one location and adaptation to downward motion at another location. During training, the nulling percentages were measured every day for adaption to motion in a fixed direction at a fixed location. The detailed procedure within each session was shown in Fig. 2a. The procedures for coherence detection measurements were similar except that the adapters were incoherently moving dots. (b) MAE duration was measured immediately after each block of top-up adaptation for 10 of the subjects in Experiment 1.1. (c) The experimental protocol in Experiment 1.3. On each training day, subjects completed both an adaptation session at the exposed location and an unadapted coherence detection session at the control location.

