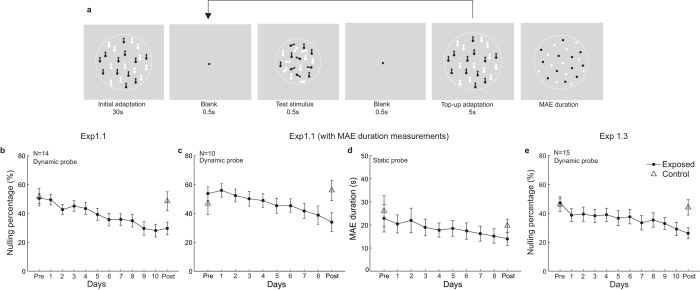
Figure 2.
Procedure and training curves for Experiments 1.1 and 1.3. (a) Adaptation procedure. Subjects judged whether the test stimulus was moving upward or downward. Adapters were presented initially for 30 s with top-ups between each trial. The duration of each top-up was 5 s in Experiments 1.1 and 1.3, but randomized between 2 s and 8 s in Experiment 1.2.1. Separated by a 0.5 s blank interval (with a fixation point), test stimuli were presented for 0.5 s which consisted of noise dots whose individual directions were random and signal dots moving in the direction opposite to the motion aftereffect (MAE). Nulling percentages, i.e. the percentage of signal dots used to perceptually null the MAE, were measured with one-down-one-up staircases. (b,c) Training curves for two groups of subjects who were or were not measured for duration of MAE in Experiment 1.1, respectively. (d) The timecourse of MAE duration. (e) Training curve for the subjects who practiced the coherence detection task at the control location. ‘●’ represented the grand average nulling percentage for the exposed condition. ‘△’ represented the grand average nulling percentage for the control condition. Error bars in all the figures represented standard error of mean.

