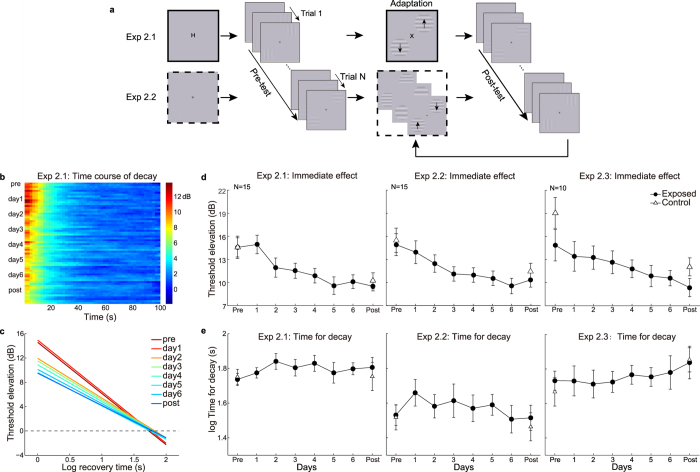
Figure 5.
Procedures and results in Experiments 2.1, 2.2 and 2.3. (a) Two sessions were completed every day, each containing four adaptation-test cycles. Contrast thresholds were measured using a ramp detection method. The thresholds were tracked for 300 s before adaptation and after each 100-s adaptation phase. In each trial, subjects pressed a key when the test gratings were just visible. The contrast of the test gratings increased logarithmically at a constant rate. The solid and dash frames represent different attentional control during the adaptation phases for the two experiments—subjects performed a central RSVP letter task in Experiment 2.1, or monitored infrequent changes in spatial frequency of the adapters in Experiment 2.2. The arrows on the adapters represent that the adapters were drifting either towards or away from each other. Before the pre-adaptation tests, subjects also performed the RSVP task without adapters in Experiment 2.1, or just stared at the fixation point in Experiment 2.2. (b) Threshold elevation aftereffect (TEAE) in unit of dB was calculated by the formula:  . Each row delineated the time course of TEAE for a single test phase. (c) Grand average fits of the decay function for TEAE in Experiment 2.1. The dash line represents the baseline estimated in each corresponding pre-adaptation test. (d) Training curves of the immediate TEAE. (e) The time for the adaptation effects to decay to the baseline on each training day.

