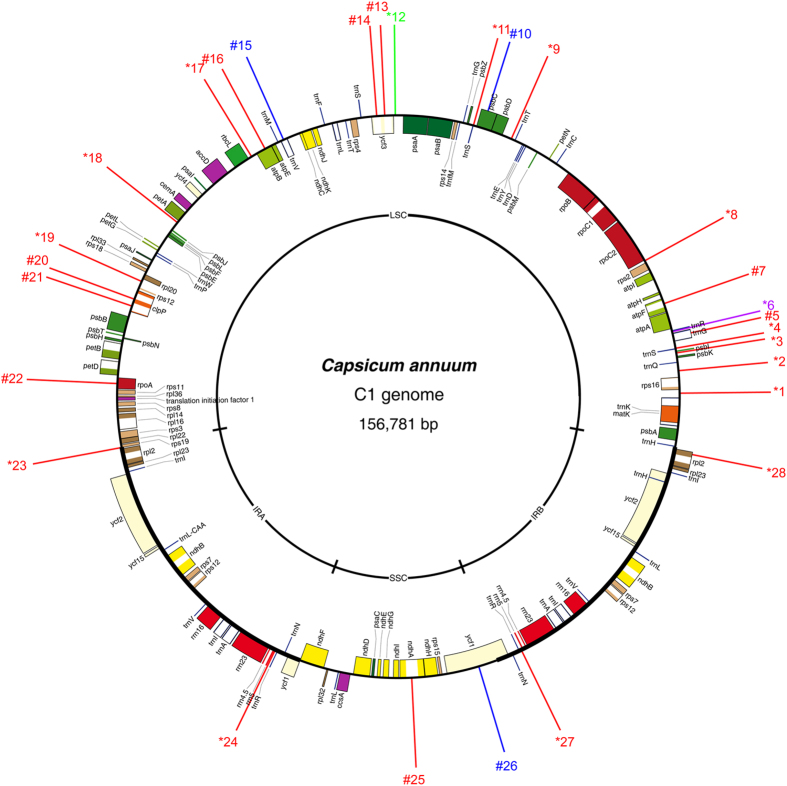
Figure 3. Overview of SSR distribution in pepper C1 chloroplast genome.
The C1 genome refers to the chloroplast genome of the pepper line ‘FS4401’ (Capsicum annuum). Perfect SSRs with 1, 3 and 4 bp length of motif are represented by red, blue and green lines, respectively. Compound SSRs are shown with purple lines. Numbers with * and # in the front means that the corresponding SSRs were located in the intergenic and genic region, respectively.

