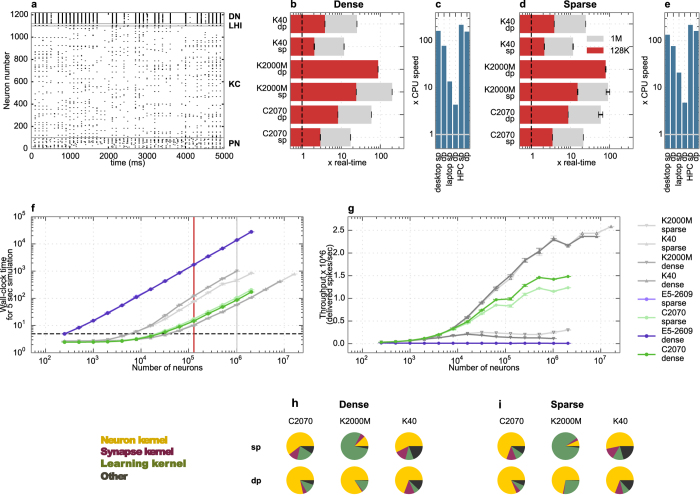
Figure 4. Execution speed of the insect olfaction model simulations using sparse and dense connectivity.
(a) Spiking activity of a network of 100 PN, 20 LHI, 1000 KC and 100 DN. (b,d) Simulation speed compared to real-time using dense (b) and sparse (d) connectivity patterns on different hardware, using single (sp) and double (dp) floating point precision, for 128,000 neurons (red bars) and 1,024,000 neurons (grey bars, N/A for K2000M dp due to memory constraints). Data is based on 7 trials for the GPUs and 1 trial for CPUs. (c,e) Maximum speedup achieved compared to the CPU, as in (b,d). (f) Detailed graph of wall-clock time for simulation of 5 simulated seconds as a function of different network sizes, using single floating point precision. Red vertical line represents simulation time for 128,000 neurons used in making the red bars, and grey line represents 1,024,000 neurons used for making the grey lines in (b,d). Real-time is shown by the dashed horizontal line. (g) Throughput (delivered spikes per sec) per neuron for the conditions shown in (f). (h,i) Proportion of time spent on different kernels for simulation of 128,000 neurons using dense (h) and sparse (i) connectivity.

