Figure 1.
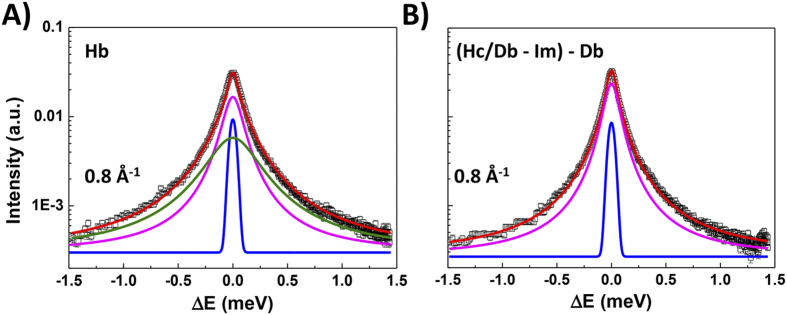
Analysis of the neutron dynamic scattering function S(Q, ω) at ambient pressure (0.1 MPa) and Q = 0.8 Å−1 for the hydrogenated buffer solution ((A): Hb) used for bacterial suspensions and an isotopic contrast ((B): [Hc/Db-Im]-Db; Im represents the intracellular medium) designed to highlight dynamics across the cell envelope. The data and lineshape fits are shown with a logarithmic intensity scale to highlight QENS contributions. The central Gaussian (blue) due to elastic scattering defines the instrumental resolution function. For aqueous solutions both translational (magenta) and rotational (green) Lorentzian components were used to fit the QENS lineshapes. These two components are related to τD (translational relaxation component corresponding to water diffusion) and τR (molecular rotational relaxational processes). The global fit (red continuous curve) is overlain on the data points (black). The isotopic contrast datasets (B) used to analyse transmembrane dynamics were fit using a single Lorentzian function. The energy transfer scale shown in meV is converted to reciprocal time (s−1) units using ΔE = ħω.

