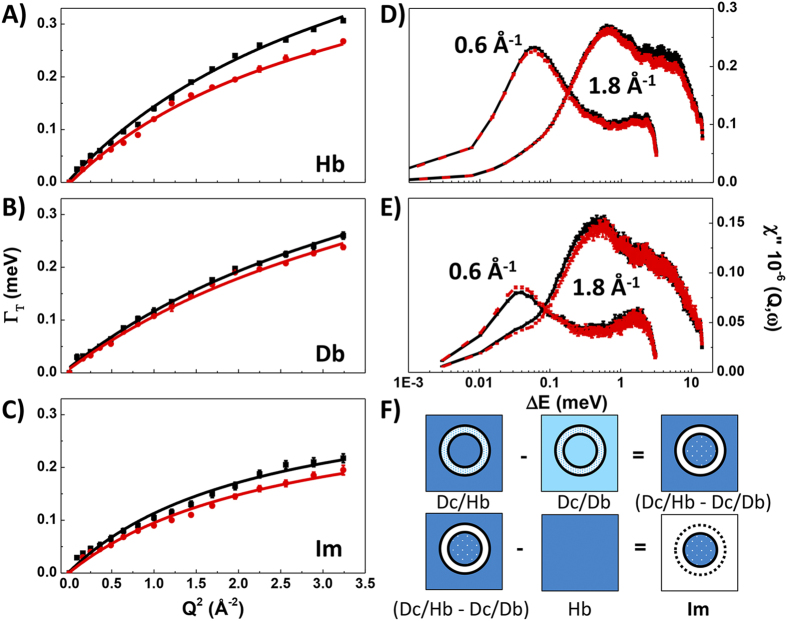
Figure 2.
Water dynamics in the aqueous suspension (panel (A): Hb, H-buffer; panel (B): Db, D-buffer) and intracellular medium (panel (C): Im) from analysis of the QENS linewidth (Γ for the translational diffusion component) as a function of momentum transfer (Q2). The isotopic contrast combination used to obtain Im was [(Dc/Hb–Dc/Db)–Hb] (panel (F)). At left are shown the ΓT(Q2) dependencies at 0.1 (black) and 200MPa (red) fit to a SS jump model. At right are shown the χ′(Q, ω) susceptibility functions determined at Q = 0.6 and 1.8 Å−1 for the aqueous solutions.

