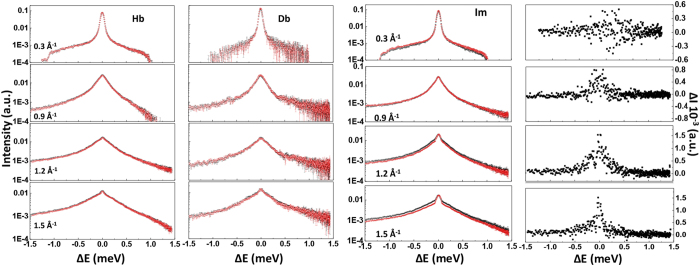
Figure 3. Selected QENS data at different Q values and 0.1 vs 200 MPa pressures.
Left panel: Comparison between neutron dynamic scattering functions S(Q, ω) at 0.1 (black symbols) and 200 MPa (red symbols) for aqueous buffer solutions (H-buffer, Hb and D-buffer, Db) at Q = 0.3, 0.9, 1.2 and 1.5 Å−1. Right panel: Comparison between neutron dynamic scattering functions S(Q, ω) at 0.1 (black symbols) and 200 MPa (red symbols) for water dynamics within the intracellular medium (Im, obtained from the following subtraction between isotopic contrasts: [(Dc/Hb–Dc/Db)–Hb]) at Q = 0.3, 0.9, 1.2 and 1.5 Å−1, showing the development of a significant pressure effect on the QENS profile at high Q values. This is absent in the case of Hb and Db buffer solutions. At far right are shown the corresponding subtractions between Im scattering profiles obtained at 0.1 and 200 MPa to highlight the effect of pressure on the QENS profile.

