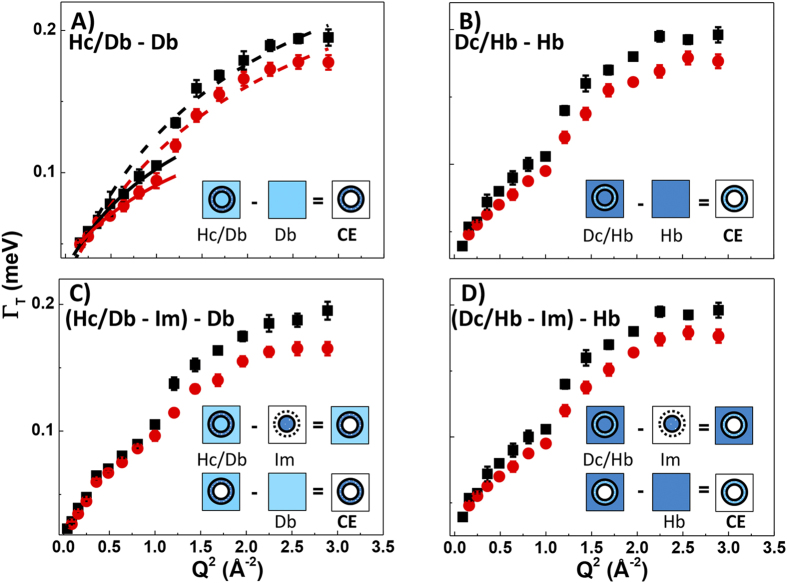
Figure 4. Water dynamics across the cell envelope (CE) at 0.1 (black) and 200MPa (red), visualised using different isotopic contrast subtractions.
(A) (Hc/Db – Db), with SS jump model fits to the overall cell envelope (0.2–1.8 Å−1) shown as dashed lines and restricted to the 0.2–1.0 Å−1 range (solid lines). (B) Data points for the corresponding isotopic contrast (Dc/Hb – Hb). Panels (C) and (D): isotopic contrasts [(Hc/Db – Im) – Db)] and [(Dc/Hb – Im) – Hb)] showing data points taking into account differential effects of pressure on Im compared with bulk media (Hb, Db).

