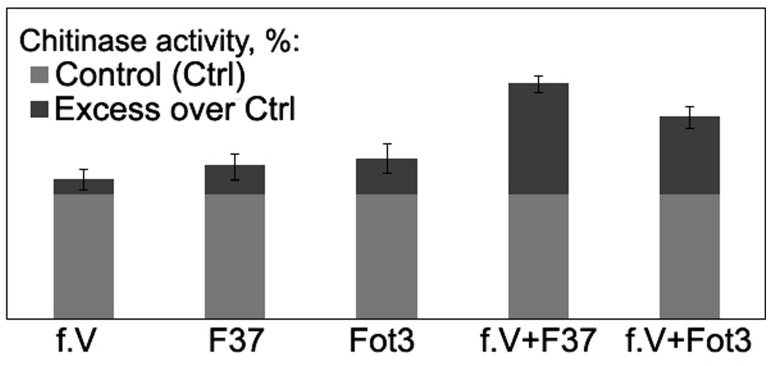
FIGURE 7.
Histograms showing percentage chitinase activity relative to control in root extracts obtained from tomato seedlings exposed to protein fraction V (f.V), pathogenic F. oxysporum f. sp. lycopersici strains F37 or Fot3 and in similar extracts from F37- or Fot3-inoculated seedlings, which were exposed to f.V prior to contact with pathogenic strains. The level of chitinase activity in extracts from roots of non-treated and non-inoculated seedlings are referred to as control (Ctrl) and taken as 100%. Presented data are means from one of two experiments, both of them showed similar results. Bars represent SE.

