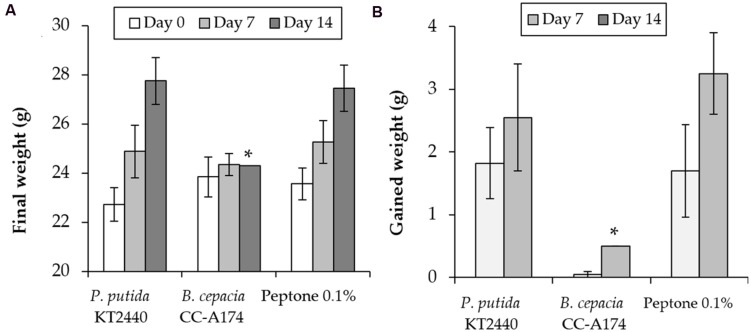
FIGURE 5.
Pathogenicity tests in laboratory mice (Mus musculus CD1). Time course of changes in total weight (A) and weight gain (B) in mice after i.p. injection of P. putida KT2440, B. cepacia CC-A174 or a 0.1% peptone solution. Significant differences are indicated with an asterisk. The values shown are the mean and standard deviation of three measurements.

