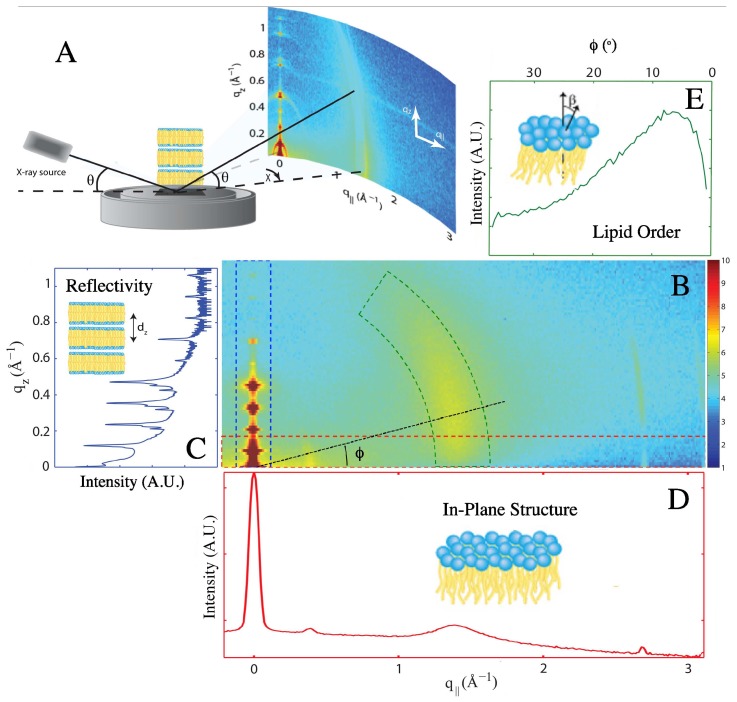
Figure 2.
Extraction of one-dimensional scattering data from the 2D X-ray diffraction map. (A) Experimental X-ray diffraction set-up, showing how 2D intensity maps were recorded for stacks of highly-oriented lipid membranes. (B) 2D intensity map obtained for 1-palmitoyl-2-oleoyl-phosphatidylcholine (POPC) membranes. The 1D scattering data shown in (C,D,E) were obtained by integrating the data in the 2D map either over a small -range to obtain reflectivity curves as a function of (C), over a small -range to obtain in-plane scattering curves as a function of (D) or over a small q-range to obtain scattering curves as a function of ϕ (E). The regions of the 2D map used to generate each kind of 1D scattering curve are indicated by the corresponding coloured boxes.

