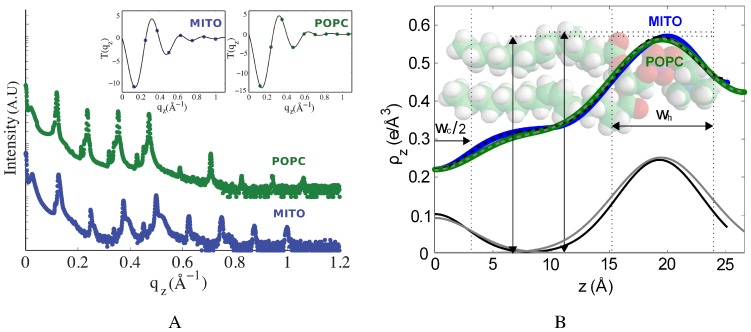
Figure 3.
Electron density profiles of the mitochondria-like and POPC membranes. (A) The reflectivity curves for the mitochondria-like and POPC membranes (the latter was shifted upwards for clarity) show eight and nine well-developed Bragg peaks, respectively. The insets show the fits of the peaks amplitude with the continuous function, plotted for the best combination of phases, . (B) The electron density profiles of the mitochondria-like and POPC membranes were determined from the data shown in (A) and modelled with Gaussian peak profiles to represent different lipid molecular components, as explained in the text. The Gaussian components of the fit corresponding to the headgroup region and the chain terminal region are represented in black and grey for the mitochondria-like and POPC membranes, respectively. Dashed lines represent the result of the fit. The FWHMs of the headgroup region, , and chain terminal region, , are indicated on the figure, and their values are listed in Table 1.

