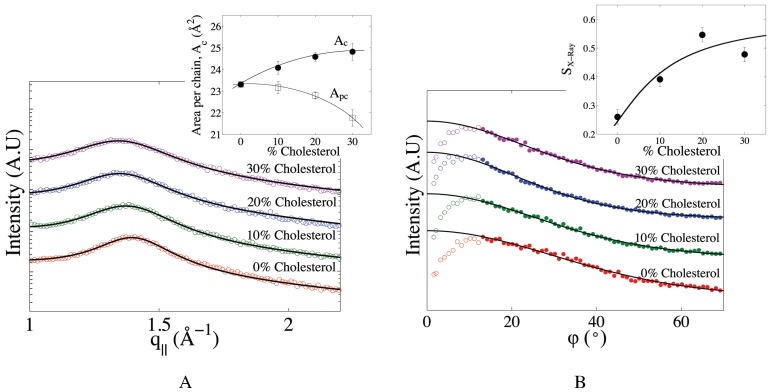
Figure 4.
Effect of cholesterol on the packing and orientational order of mitochondria-like membranes. (A) Chain correlation peaks for mitochondria-like membranes containing between 0 and 30 mol% cholesterol. Each curve is fit with a Gaussian profile on a slopping background (solid lines). Curves are shifted vertically for clarity. Inset: average area per chain (i.e., including cholesterol chains), , directly inferred from the position of the peak (filled symbols), compared to the average area per phospholipid chain, , as corrected for cholesterol volume using Equation (2) (open symbols). Solid lines are a guide for the eyes. (B) Integrated intensities of the chain correlation peak as a function of polar angle. Curves are shifted vertically for clarity. Continuous lines represent fits of the filled symbol data with Equation (4), while the open symbols were not included in the fit. Inset: X-ray chain orientational order parameter, , calculated from that fit.

