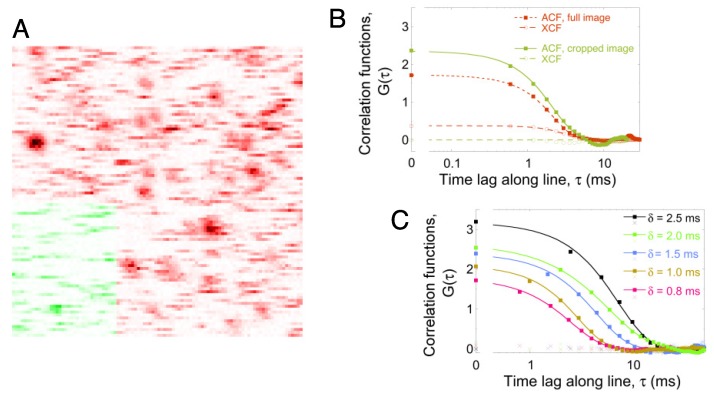
Figure 1.
(A) Confocal image of a mitochondria-like lipid bilayer containing 0.0025 wt% DiD. Both streaks (corresponding to diffusing DiD molecules) and spots (corresponding to immobile or very slow DiD molecules) can be seen in this image. The image has been inverted for clarity. The highlighted green part seems to contain mostly streaks and was cropped and used for separate analysis. Image size: 10 μm × 10 μm; pixel size: d = 100 nm; pixel dwell time: δ = 0.6 ms. (B) Average line autocorrelation functions (filled squares) and line cross-correlation functions (empty circles) computed for either the full image (red symbols) or the cropped portion of the image highlighted in green (green symbols) in (A). The data have been fit with Equation (1) (continuous line), Equation (2) (dashed lines) or Equation (3) (dotted line). (C) Line autocorrelation functions (filled squares) and line cross-correlation functions (crosses) obtained for different images of the sample shown in (A), imaged at different pixel dwell times and cropped to include only mobile particles. The line autocorrelation functions have been fit with Equation (1) (continuous line).

