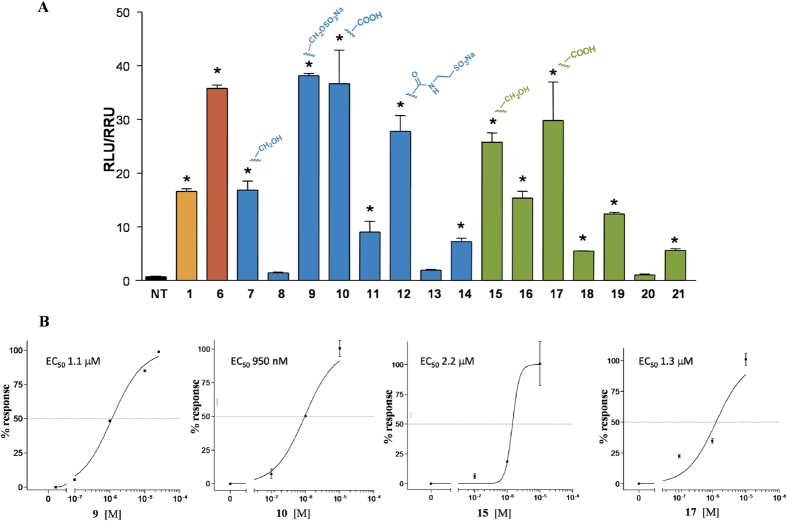
Figure 6. Transactivation assays on FXR.
(A) HepG2 cells were transfected with pSG5-FXR, pSG5-RXR, pCMV-βgal, and p(hsp27)TKLUC vectors. Cells were stimulated with compounds 7–21 (10 μM). CDCA (1, 10 μM) and 6-ECDCA (6, 1 μM) were used as a positive control. Results are expressed as mean ± standard error; *p < 0.05 versus not treated cells (NT); (B) Concentration-response curve of 9, 10, 15 and 17 on FXR in a luciferase reporter assay using HepG2 cells transfected with FXR. Twenty-four hour post transfection cells were stimulated with increasing concentrations of each agent: range from 100 nM to 10 μM.

