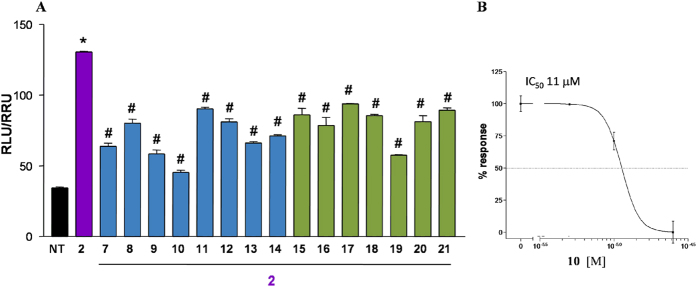
Figure 9. Antagonism on GPBAR1 by transactivation assay.
(A) HEK-293T cells were transfected as described in Fig. 8. Twenty-four hour post transfection cells were stimulated with 10 μM TLCA (2) alone or in combination with 25 μM compounds 7–21. #p < 0.05 versus TLCA stimulated cells; (B) Concentration-response curve of 10 on GPBAR1 in combination with TLCA (2, 10 μM) and with increasing concentrations of 10: range from 5 to 25 μM. Results are expressed as mean ± standard error.

