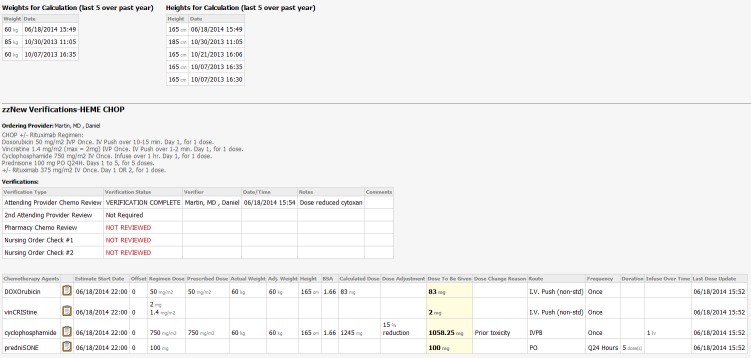
Fig. 2.
Chemotherapy Dosing Summary Mpage. Tables above display the most recent five height and weight values. A synopsis of the standard chemotherapy regimen including doses and details is included for references. Verifications are shown and colored according to status including provider name and comments. The actual doses ordered and the data used to make the calculations is displayed in a tabular format with the reference doses included for comparison.

