
Figure 6. Changes induced in coralline photosynthesis rates relative to the estimated minimum photosynthesis requirement for coralline calcification (MPR).
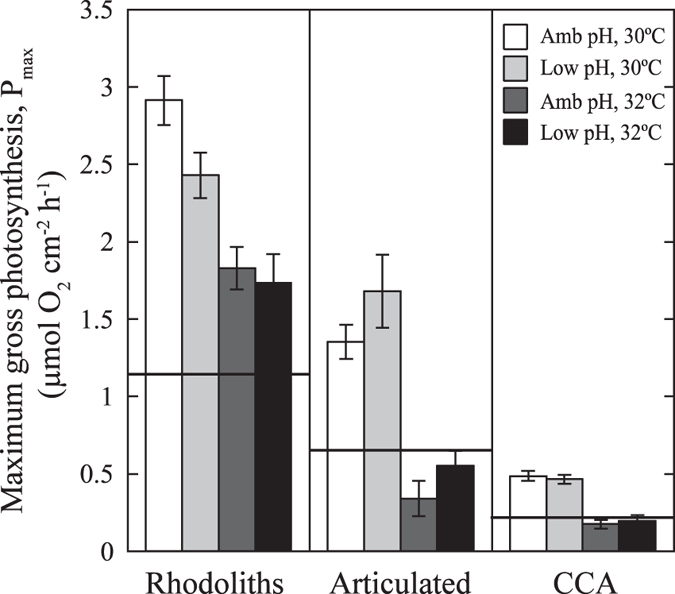
The bars represent mean values ± SEM of absolute photosynthesis after 10 days under the experimental treatments (n = 4–8). Horizontal lines represent the estimated minimum photosynthesis requirement (MPR) for each species from the sigmoidal fit (see Fig. 2b and text for details).