
Figure 7. Analysis of blood biochemical parameters.
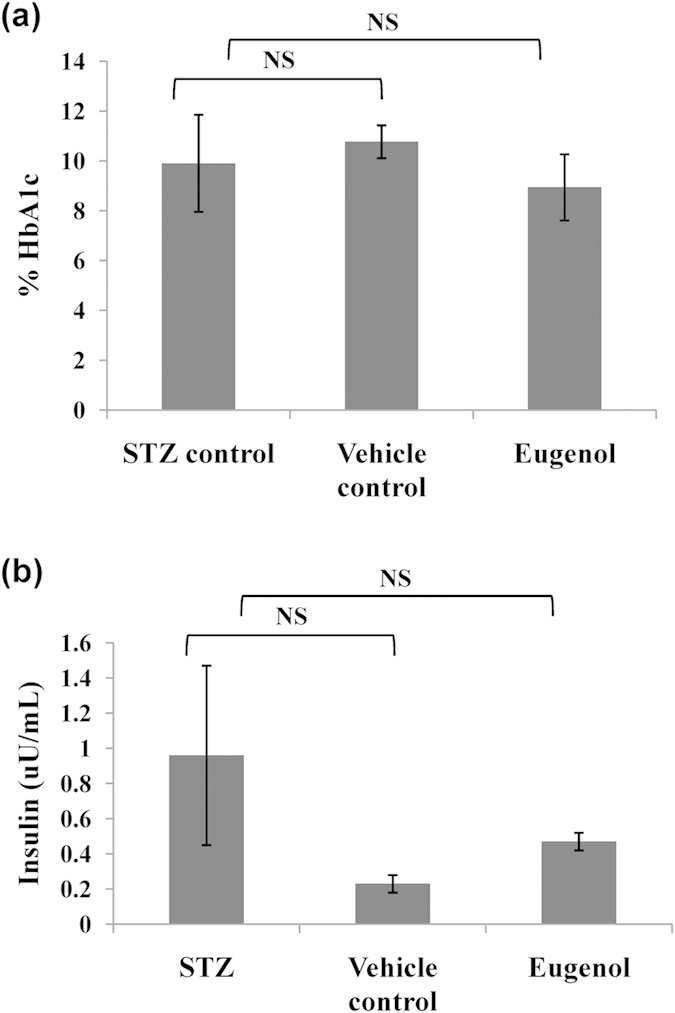
Measurement of (a) HbA1c, (b) plasma insulin. Unpaired t-test suggested significant differences between data at p < 0.05 (indicated as ‘*’). NS represents non-significant difference in data.
Official websites use .gov
A
.gov website belongs to an official
government organization in the United States.
Secure .gov websites use HTTPS
A lock (
) or https:// means you've safely
connected to the .gov website. Share sensitive
information only on official, secure websites.
Measurement of (a) HbA1c, (b) plasma insulin. Unpaired t-test suggested significant differences between data at p < 0.05 (indicated as ‘*’). NS represents non-significant difference in data.