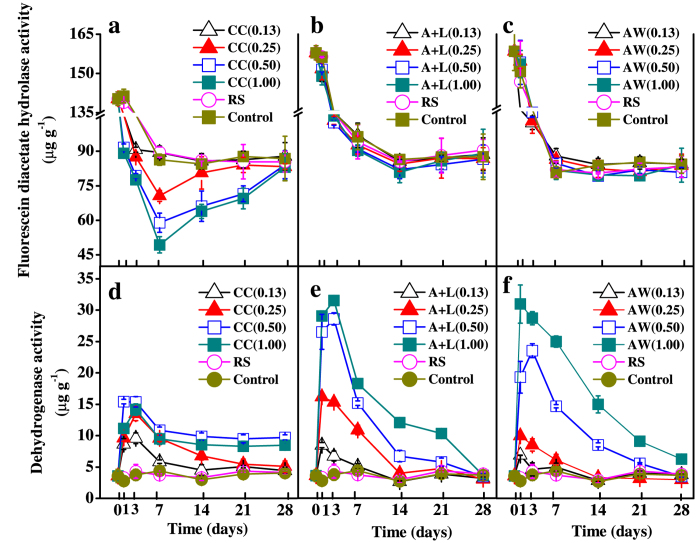
Figure 3.
Changes in FDA hydrolysis and dehydrogenase activity after the application of calcium cyanamide (a,d), ammonium bicarbonate and lime mixture (b,e) and ammonia water (c,f), respectively. Data are the means ± SD (n = 4) shown by vertical error bars. The explanations of treatment abbreviations are referred to Table 2.

