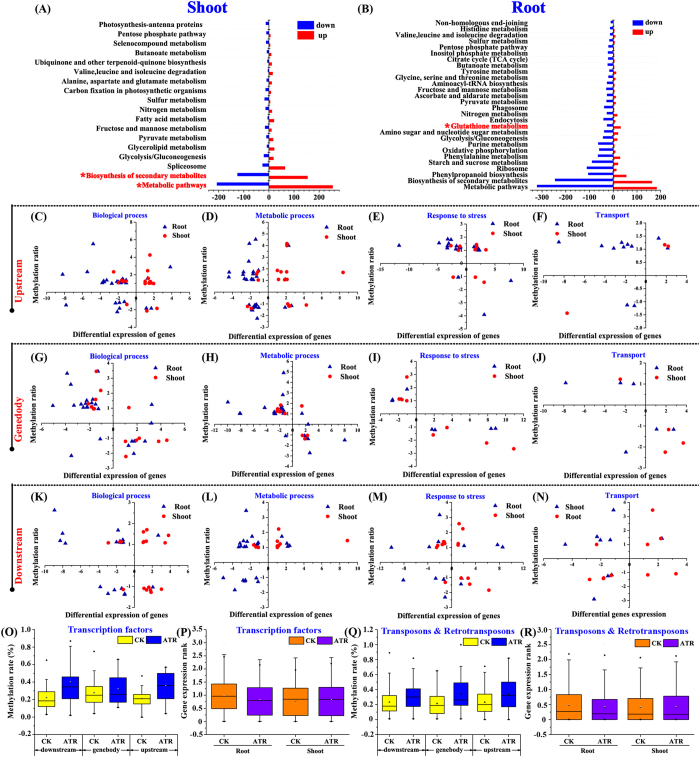
Figure 2. Transcriptome analysis of ATR-exposed rice.
(A,B) Enrichment of significant pathways (p-value < 0.05, Q value < 0.05) in KEGG in each pair of rice libraries (shoot + ATR vs shoot-ATR, root + ATR vs root-ATR). (C~N) The relations between DNA methylation and mRNAs at various genomic regions. Differential expression of genes (|Log2TPMtreatment/TPMCK| ≥1, y axis) as a function of DMGs (|Log2μtreatment/μCK| ≥1, x axis) in hierarchical clustering (biological process, metabolic process, response to stress and transport). DNA methylation rates of transcription factor-coding genes (O, P) and transposon/retrotransposon (Q, R). Boxes in O to R represent the quartiles and whiskers marking the minimum and maximum values.

