
Figure 2. Mean rejection rates broken down by fairness and group.
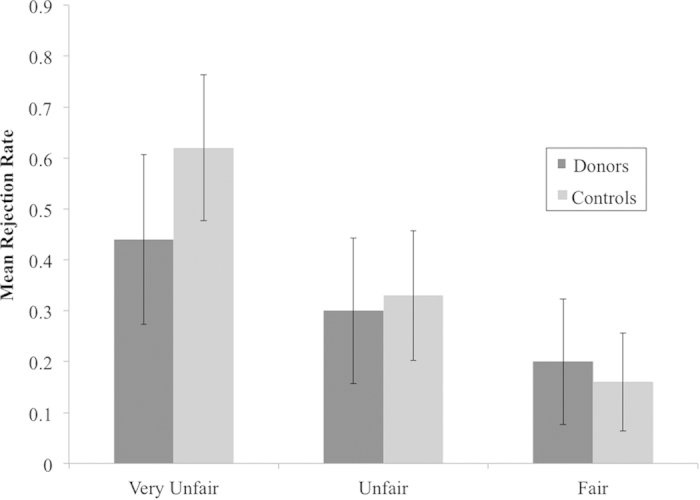
With education and its interaction with fairness in a model with group, fairness, and the group × fairness interaction, the predictive value of the group × fairness interaction was significant, χ2(2) = 8.69, p = 0.013; however, pairwise comparisons between kidney donors and controls within each level of fairness were nonsignificant, all p > 0.05. Error bars represent 95% confidence intervals, based on the SEM.