
Figure 1. Trends in HIV Prevalence and Proportion of Undiagnosed Infections (1987–2013).
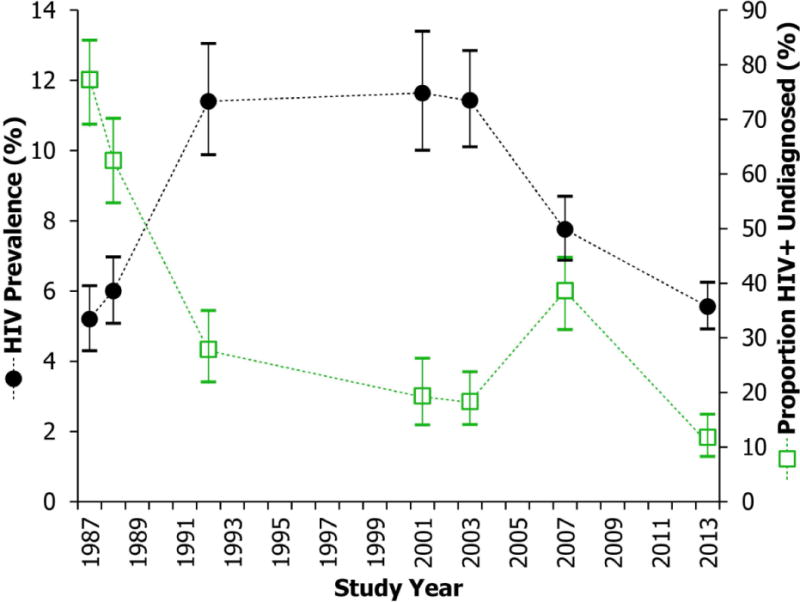
The black circles denote the HIV prevalence during each identity-unlinked serosurvey. The green squares represent the proportion of HIV positive patients in each identity-unlinked serosurvey who were not aware of their HIV positive serostatus. The vertical lines indicate 95% confidence intervals.