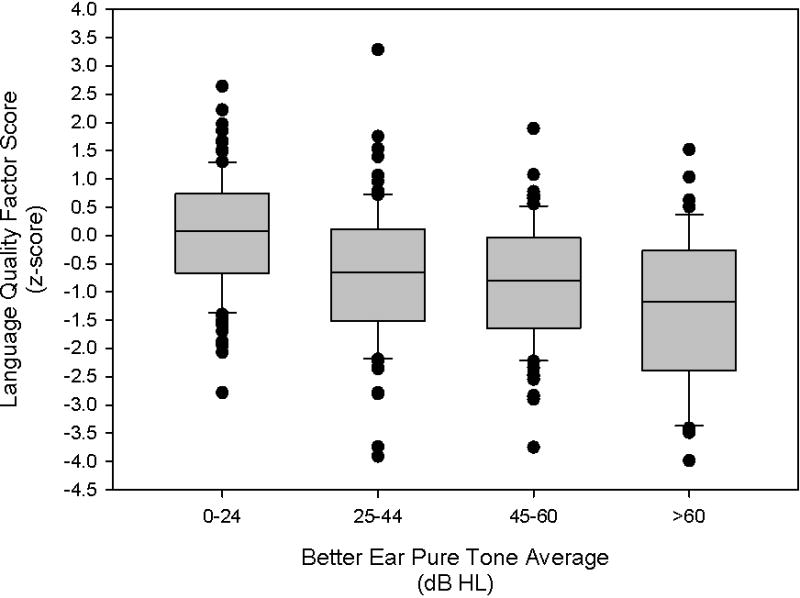
Figure 8.

Box and whisker plots of factor scores for measures of spontaneous language that reflect language quality across levels of pure tone hearing. Boxes represent 25th through 75th percentile and line in box represents the median. Whiskers extend to maximum and minimum values excluding outliers shown as filled circles.
