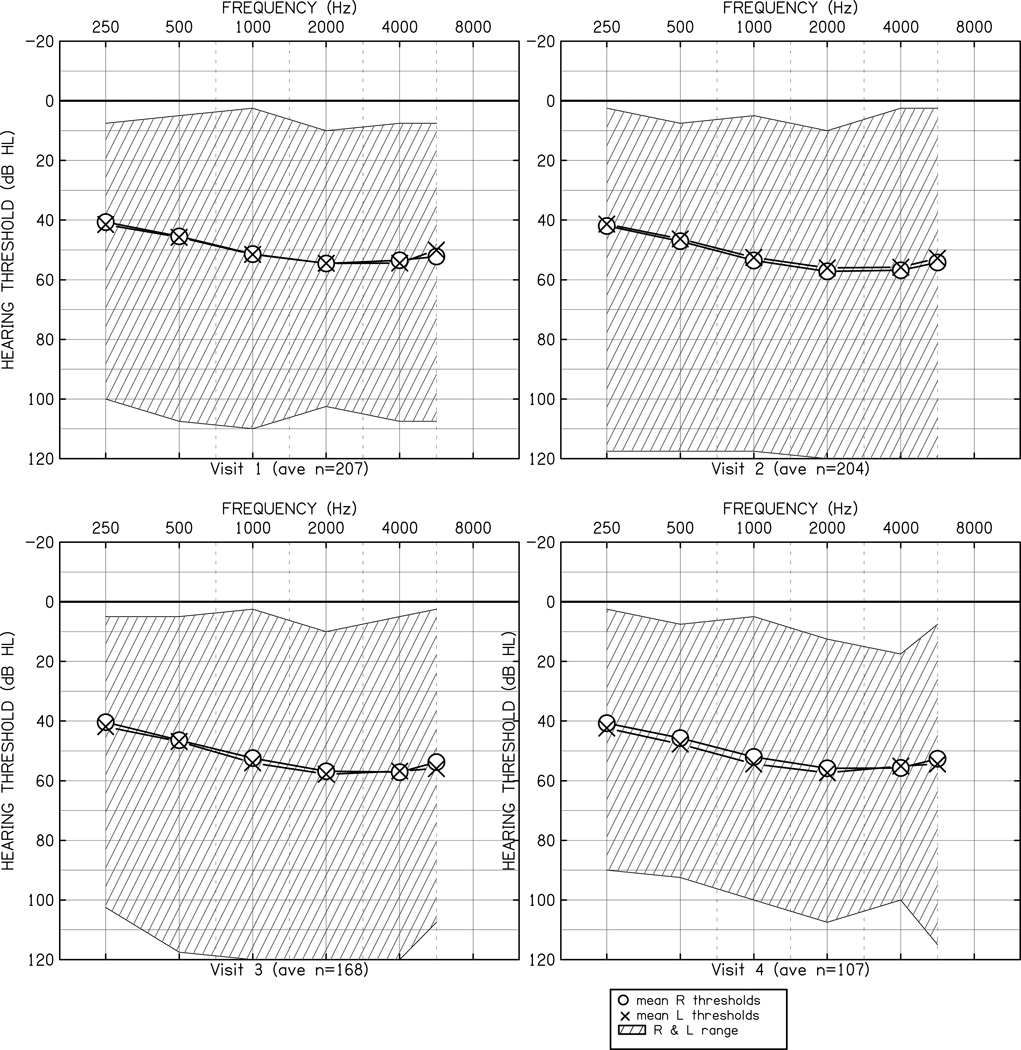
Figure 1.
Audiometric thresholds in dB HL as a function of frequency in Hz. The O (right ear) and X (left ear) symbols represent the mean thresholds at each frequency. The cross-hatched area represents the range of thresholds in the sample at each frequency. Each panel displays thresholds for a specific study visit.

