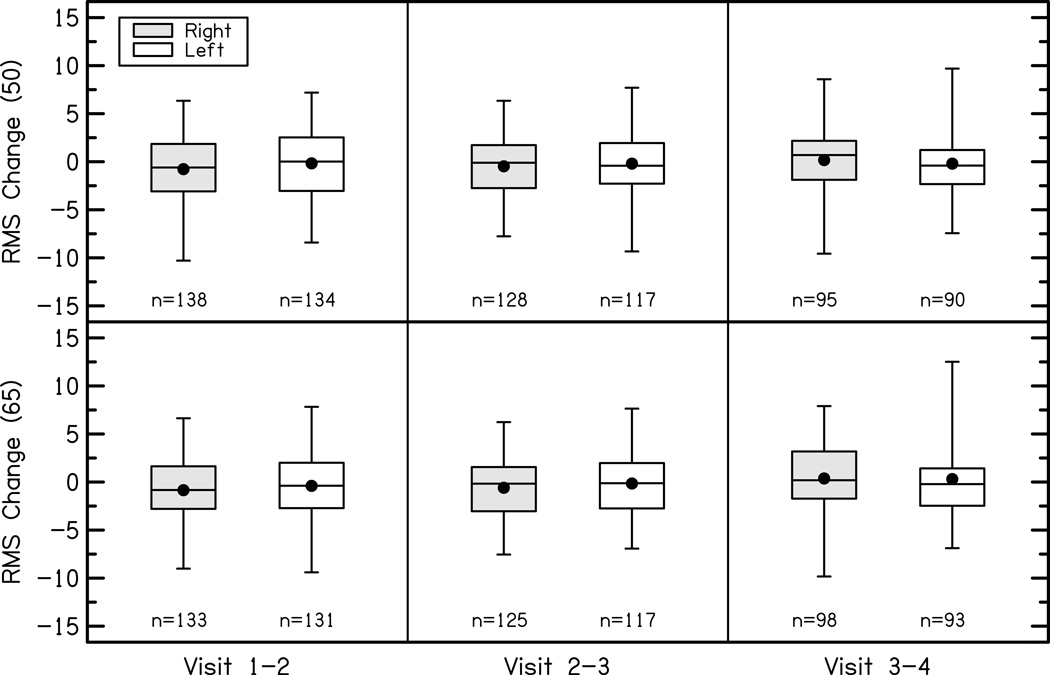
Figure 6.
Change in RMS errors for right (shaded) and left (white) ears for soft (top panel) and average (bottom panels) speech input levels between each study visit (columns). The boxes represent the 25th-75th percentiles (interquartile range) and the whiskers represent the 5th and 95th percent confidence intervals of the mean. Solid lines are the median and solid circles represent the mean.

