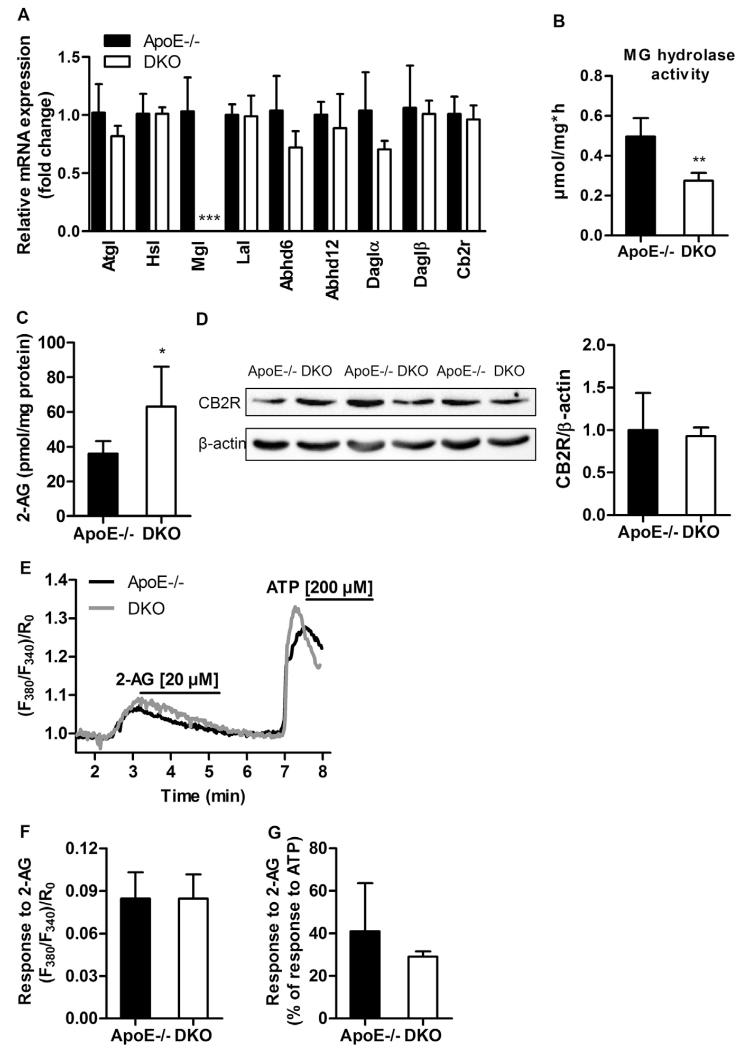
Fig. 3.
EC signaling is intact in DKO macrophages. (A) Macrophage mRNA expression was analyzed in duplicate by real-time PCR and normalized to Hprt expression as reference gene. Data represent means (n = 4–5) + SD. (B) MG hydrolase activity presented as means (n = 6) + SD. (C) Macrophage 2-AG concentrations presented as means (n = 6) + SD. (D) Western blot analysis of CB2R protein expression in macrophages. Densitometric quantification of CB2R/β-actin (loading control) represent means (n = 3) + SD. (E) Representative traces of cytosolic Ca2+ signals in macrophages upon stimulation with 20 μM 2-AG and 200 μM ATP shown as normalized ratio (F380/F340)/R0. (F) Statistical evaluation of Ca2+ signals in macrophages in response to 2-AG; (n = 4–6) + SD. (G) Cytosolic Ca2+ response of macrophages to 2-AG calculated as percentage of response to ATP; (n = 4–6) + SD. *, p < 0.05; **, p ≤ 0.01; ***, p ≤ 0.001.

