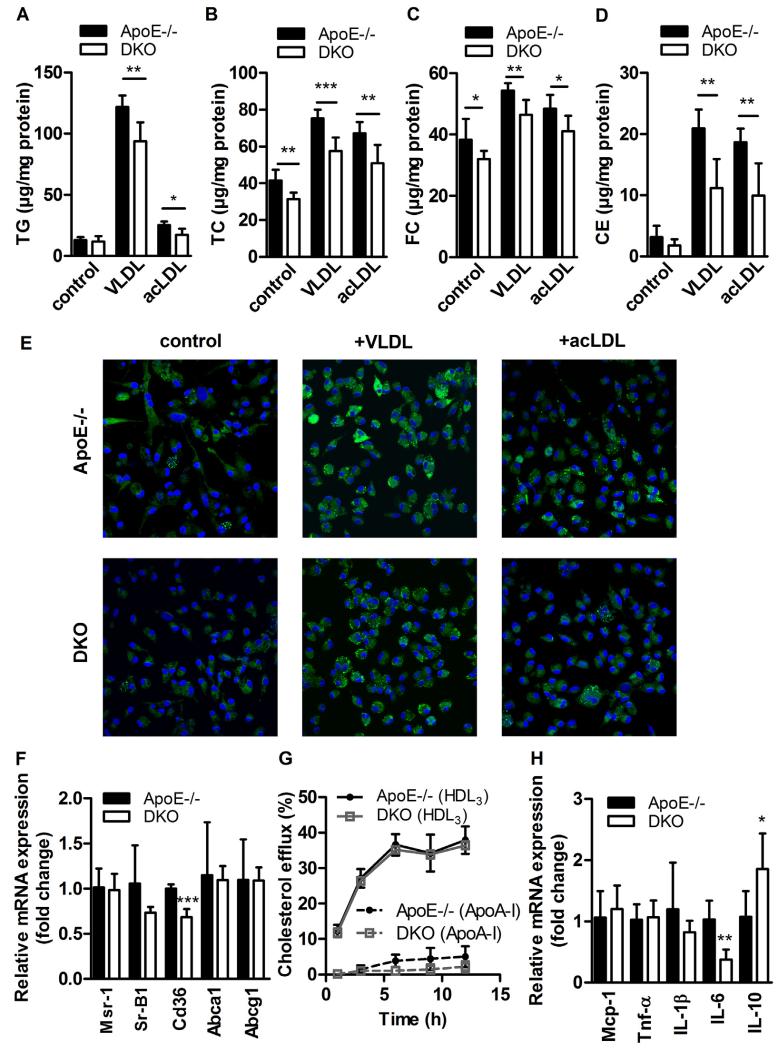
Fig. 4.
Reduced foam cell formation in DKO macrophages. Peritoneal macrophages were plated in 6-well plates for 24 h ± VLDL or acetylated (ac)LDL (100 μg protein/ml medium). After lipid extraction, (A) TG, (B) TC, and (C) FC concentrations were measured spectrophotometrically, and (D) CE concentrations were calculated as TC minus FC. Data represent means (n = 5–7) + SD. (E) Lipid droplets were visualized after Nile red staining (2.5 μg/ml) by confocal laser scanning microscopy. (F) mRNA expression of lipid transport genes analyzed in duplicate by real-time PCR and normalized to Hprt expression as reference gene. Data represent means (n = 4–5) + SD. Relative mRNA expression and associated statistical parameters were determined by the 2−ΔΔCT method. (G) Cholesterol efflux to Apo-AI and HDL3 expressed as the percentage of [3H]cholesterol transferred from cells to the medium. Data show means (n = 3) ± SD of triplicate repeats. (H) mRNA expression of cytokines in macrophages treated with acLDL (100 μg protein/ml medium) for 24 h analyzed in duplicate by real-time PCR and normalized to Hprt expression as reference gene. Data represent means (n = 3–5) + SD. *, p < 0.05; **, p ≤ 0.01; ***, p ≤ 0.001.

