Fig. 6.
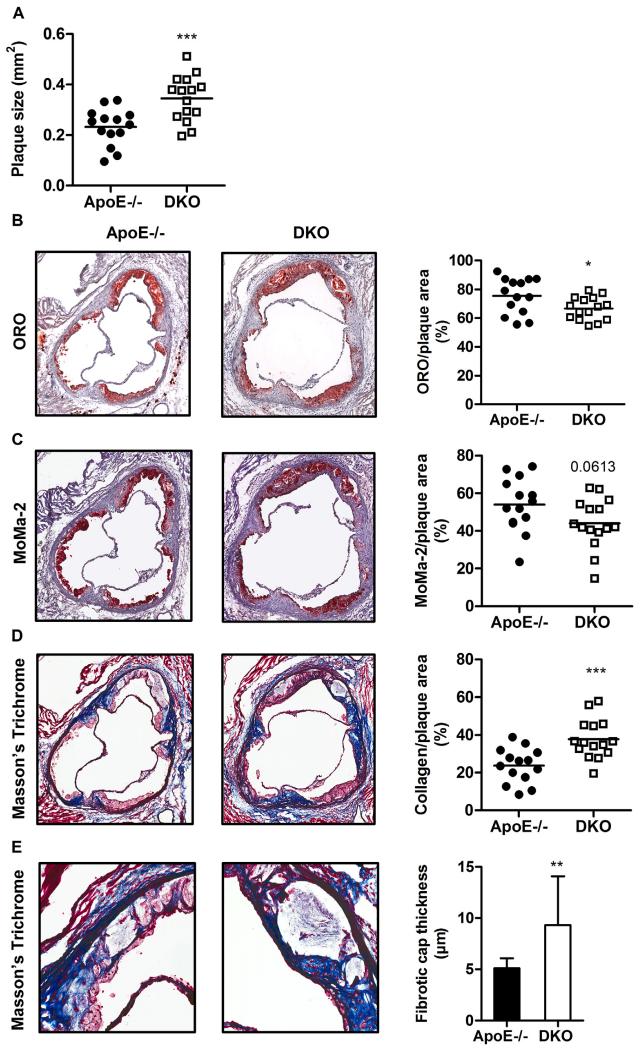
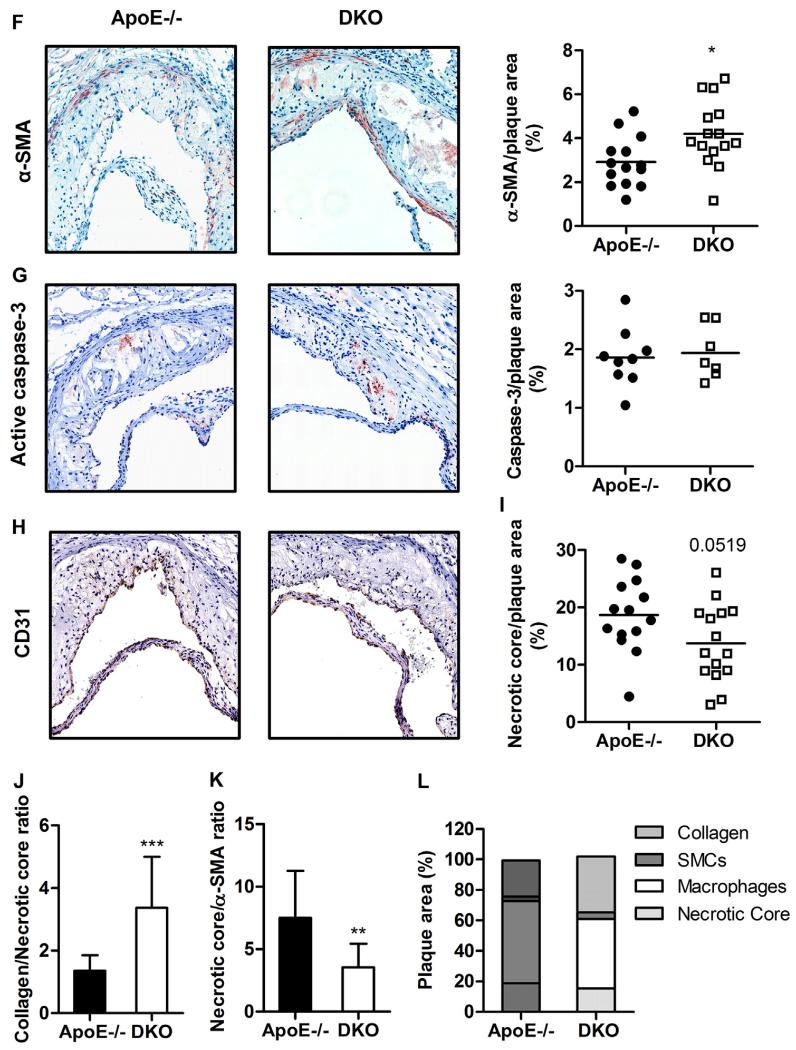
Atherosclerotic plaques are more stable in DKO mice. (A) Total lesion size measurements, (B) Oil red O (ORO)-stained lipids (magnification: 5×), (C) MoMa-2 immunohistochemically-stained macrophages (red) (magnification: 5×), (D) Masson’s Trichrome-stained collagen (blue) (magnification: 5×), (E) fibrotic cap thickness (n = 14–15) (magnification: 20×), (F) α-smooth muscle actin (α-SMA) immunohistochemically-stained smooth muscle cells (red) (magnification: 15×), (G) active caspase-3 immunohistochemically-stained apoptotic cells (red) (magnification: 15×), and (H) CD31 immunohistochemically-stained neovessels (brown) (magnification: 15×). Data represent mean values of 15 aortic valve sections for lesion size measurements and 3 aortic valve sections in the area of maximal plaque size for ORO, MoMa-2, Trichrome, α-SMA, active caspase-3, and CD31 for each mouse. Bars represent means. Quantification of (I) necrotic core per plaque area, (J) collagen per necrotic area (n = 14–15), and (K) necrotic per α-SMA area (n = 14–15). Data represent means + SD. (L) Distribution of necrotic core, macrophages, smooth muscle cells, and collagen within the plaque. Data represent means (n = 14–15) + SD. *, p < 0.05; **, p ≤ 0.01; ***, p ≤ 0.001.


