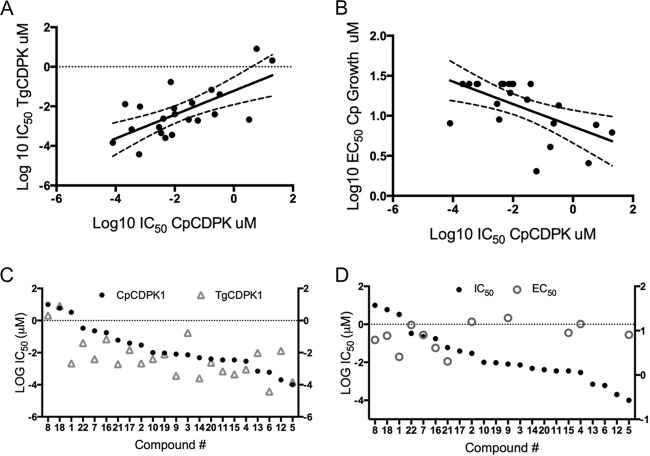
FIG 2.
Comparison of the activities of TgCDPK1 and CpCDPK1 enzyme inhibitors and inhibition of C. parvum growth. (A) Comparison of the sensitivities of the CpCDPK1 and TgCDPK1 enzymes to inhibitors in vitro. Linear regression is shown; dashed lines indicate 95% confidence intervals. (B) Plot of IC50s of individual compounds for the CpCDPK1 and TgCDPK1 enzymes. Linear regression is shown; dashed lines indicate 95% confidence intervals. (C) Sensitivity of CpCDPK1 enzyme activity (IC50) versus growth (EC50) of C. parvum in culture to inhibitors. (D) Plot of IC50s of individual compounds for CpCPKD1 enzyme activity versus EC50s against C. parvum growth. IC50s and EC50s are from Table 1.

