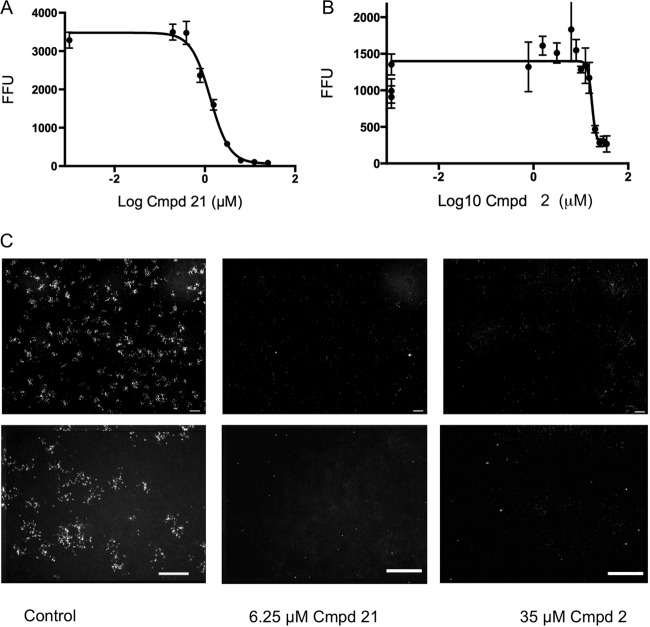
FIG 4.
Effects of selected compounds on C. parvum growth as determined by IFA assays. (A) Dose response of inhibition of growth was monitored by IFA assay detection of intracellular C. parvum forms as described in Materials and Methods. FFU values represent means ± standard deviations (n = 3). Curve fitting was performed by nonlinear regression with Prism (GraphPad). (B) Representative images of IFA staining of control and compound (Cmpd) 1- and 21-treated cultures. The upper set of images depicts representative single-well montage photomicrographs (comprising nine fields) of a 96-well plate as described in Materials and Methods. The lower images are each enlargements representing one of the nine image frames shown in the corresponding upper images. EC50s are provided in Table 1. Scale bars, 200 μm.

