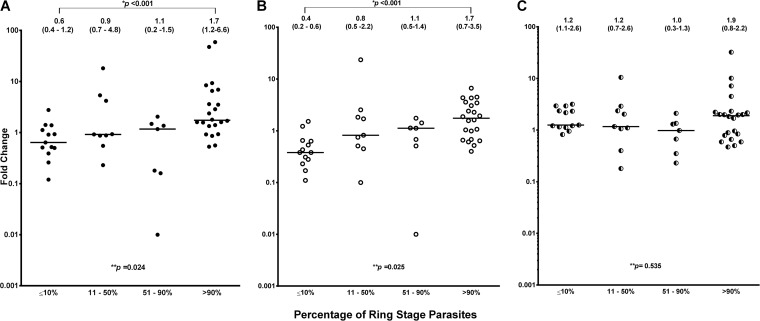
FIG 2.
Expression levels of pvcrt-o, the P. vivax β-tubulin gene, and the P. vivax aldolase gene as a function of development stage. Data represent median (interquartile range) fold expression changes of pvcrt-o relative to the P. vivax β-tubulin gene (A), pvcrt-o relative to the P. vivax aldolase gene (B), and the P. vivax aldolase gene relative to the P. vivax β-tubulin gene (C) in isolates according to the proportion of parasites at the ring stage of development (**, Kruskal-Wallis test; *, Mann-Whitney U test). The horizontal lines represent the median fold change of gene expression.

