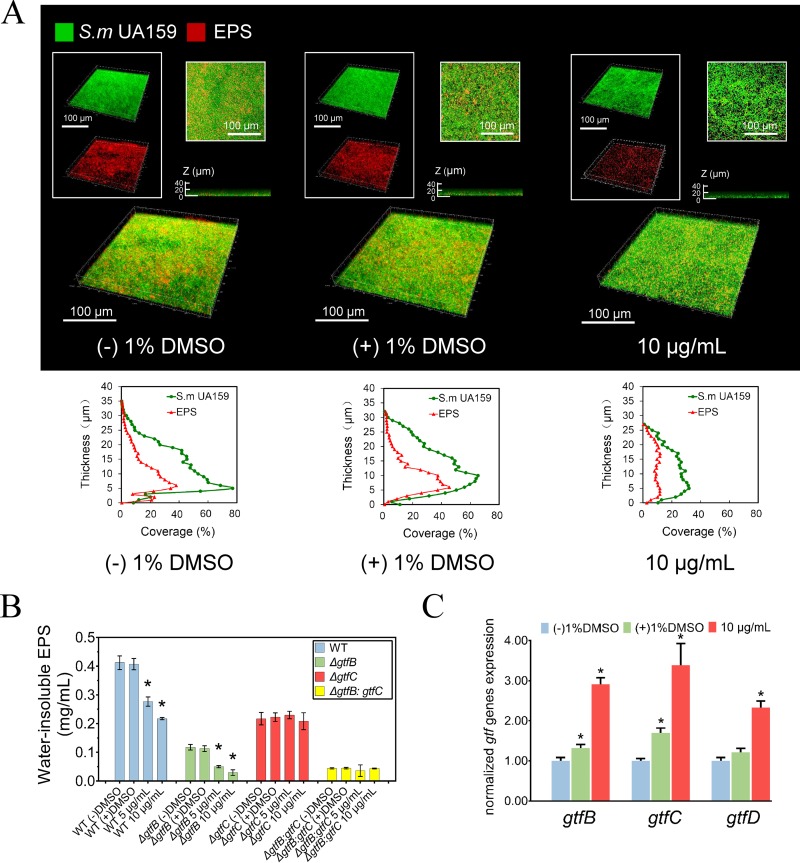
FIG 2.
Effect of the compound on the synthesis of polysaccharides in S. mutans biofilms. (A) Double-labeling imaging and three-dimensional visualization of EPS (red) and bacteria (green) of an S. mutans biofilm formed on the surface of glass coverslip. Images were taken at 60× magnification. Quantitative analysis was performed with COMSTAT, showing the distribution of EPS and bacteria from the coverslip surface to the fluid phase interface. (B) The quantitative data of the water-insoluble polysaccharide amount of S. mutans UA159 (WT) and the gtf mutants determined colorimetrically by anthrone-sulfuric method. (C) S. mutans gtf gene expression determined by quantitative RT-PCR. 16S rRNA was used as an internal control. Values represent the means ± standard deviations from three independent experiments. *, Significant difference compared with the untreated control (P < 0.05).

