
FIG 2.
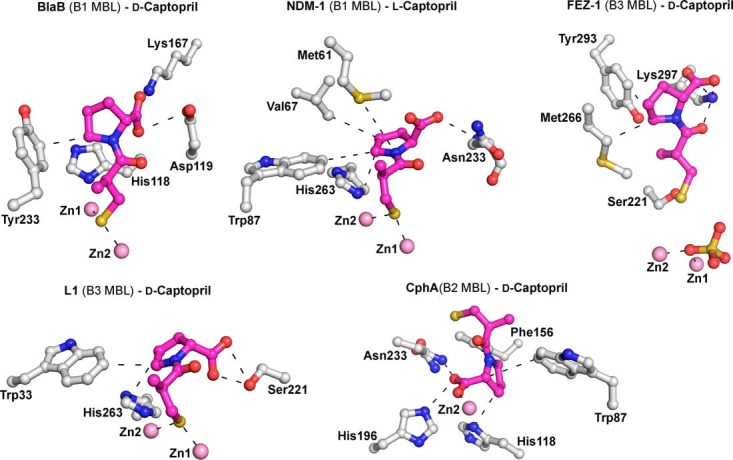
Crystallographic analysis reveals different binding modes for d- and l-captopril. Preliminary crystal structures are shown for BlaB, NDM-1, CphA, FEZ-1, and L1 complexed with l- and d-captopril (PDB entries 1M2X [1.50 Å], 4EXS [2.40 Å], 2QDS [1.66 Å], 1JT1 [1.65 Å], and 2FU8 [1.80 Å]). Zinc ions are represented by pink spheres, d- and l-captopril ligands are shown in magenta, and the amino acid residues interacting with captopril are depicted as gray stick models. Hydrogen bonds, zinc coordination bonds, and hydrophobic interactions are shown as thin black dashes.