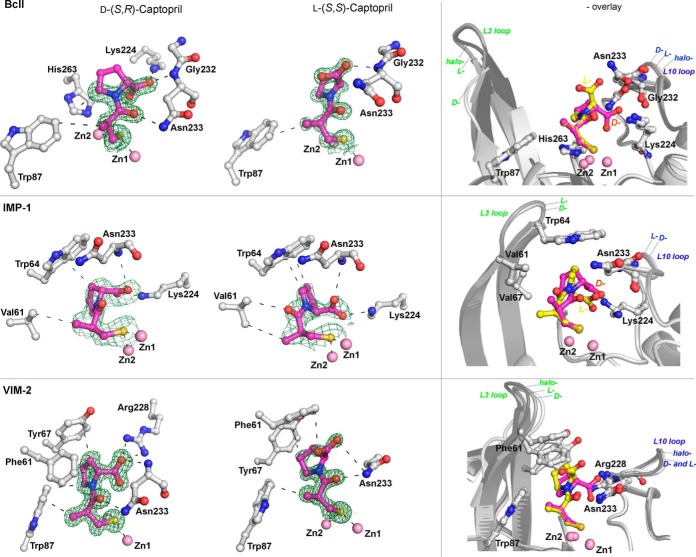
FIG 4.
Crystallographic analyses reveal different binding modes for d- and l-captopril. The left column shows views of structures of BcII, IMP-1, and VIM-2 complexed with l- and d-captopril (PDB entries 4C1H [1.10 Å], 4C1C [1.18 Å], 4C1F [2.01 Å], 4C1G [1.71 Å], 4C1D [1.20 Å], and 4C1E [1.40 Å], respectively), highlighting residues involved in inhibitor-MBL complex formation. The right column shows an overlay of structures in the absence/presence of d- or l-captopril; these reveal L3 and L10 loop movements on inhibitor binding. With BcII, a comparison of the L3 loop was not possible, because some part of it was not modeled, but clear movement was identified for the L10 loop. In the case of IMP-1, we did not obtain a di-Zn(II) structure without an inhibitor; a comparison with published IMP-1 structures is difficult because of different crystallization conditions, but in the d- and l-captopril structures both the L3 and L10 loops display different conformations. Zinc atoms are represented by pink spheres, the d- and l-captopril ligands are shown in magenta, and the amino acid residues interacting with captopril are shown as gray stick models. The electron density maps (Fo-Fc) are contoured to 3.0 σ and shown in green. Hydrogen bonds, zinc coordination bonds, and hydrophobic interactions are shown with thin black dashes. The MBL backbone in the overlay plots is shown in gray, and the flexible active site loops are shown in different shades of gray (loops L3 and L10).

