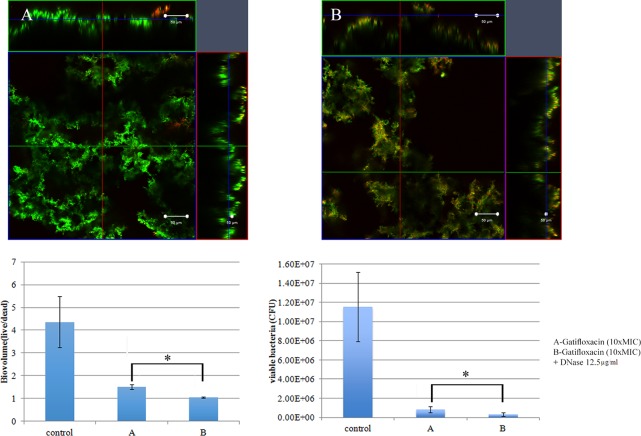
FIG 11.
Combination treatment using gatifloxacin (10× MIC) and DNase (12.5 μg/ml) on M. fortuitum biofilm. Confocal images of M. fortuitum biofilm after treatment with gatifloxacin at 10× MIC (A) or gatifloxacin at 10× MIC and DNase at 12.5 μg/ml (B) are shown. Green color represents live biomass, whereas red is dead biomass. Histograms show comparison of live/dead ratios and viable bacteria (CFU) after treatment of M. fortuitum biofilm. Scale bar, 50 μm. The values are means ± SDs from one representative experiment (five images); three independent experiments were done. Combination treatment performed somewhat better than gatifloxacin alone. Live/dead ratios and CFU were compared by using Mann-Whitney U test between two different groups. Combination versus gatifloxacin, P = 0.002 for biovolume and P = 0.043 for CFU. *, P ≤ 0.05 (statistically significant).

