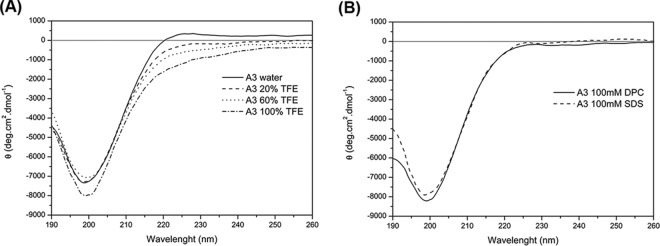
FIG 3.
CD spectra of penisin under different conditions. (A) CD spectra of A3 peptide in water (solid line), 20% TFE (dashed line), 60% TFE (dotted line), and 100% TFE (dashed-dotted line). (B) CD spectra of 100 mM DPC (solid line) and 100 mM SDS (dashed line). All CD spectra were obtained at pH 7.0 in 10 mM Tris-HCl buffer.

