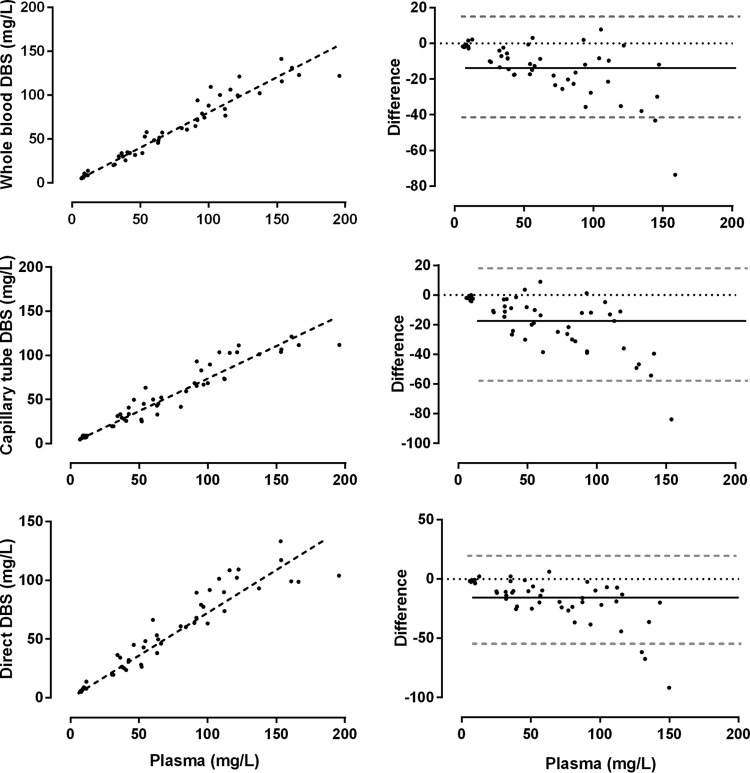
FIG 3.
Relationship between raw dried blood spot (DBS) measurements from whole blood, capillary blood from a heparinized tube, and capillary blood directly and plasma ceftriaxone concentrations from healthy volunteers. Linear regression lines (dashed black lines) are provided (left graphs). Bland-Altman plots show the mean difference (solid black line) and 95% confidence intervals (dashed gray lines) (right graphs).

