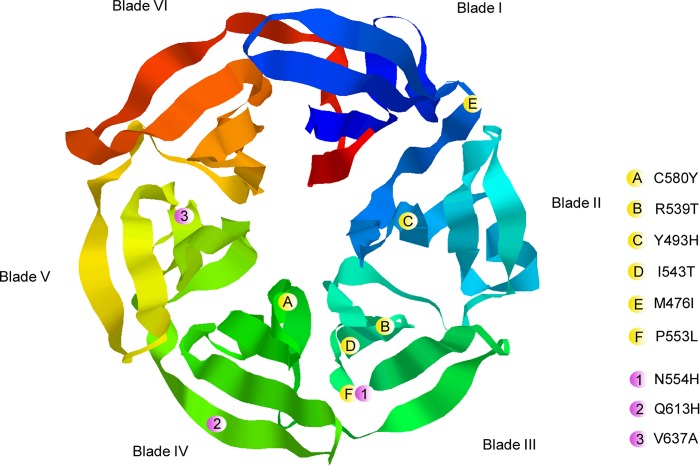
FIG 1.
Locations of the mutations in the predicted three-dimensional (3D) model of the K13 propeller domain (RasTop software, Phyre 2 server). The locations of the various mutations are indicated by spheres, in which yellow represents mutations correlated with artemisinin resistance reported by Ariey et al. (4) and pink represents mutations observed in Dakar, Senegal.

