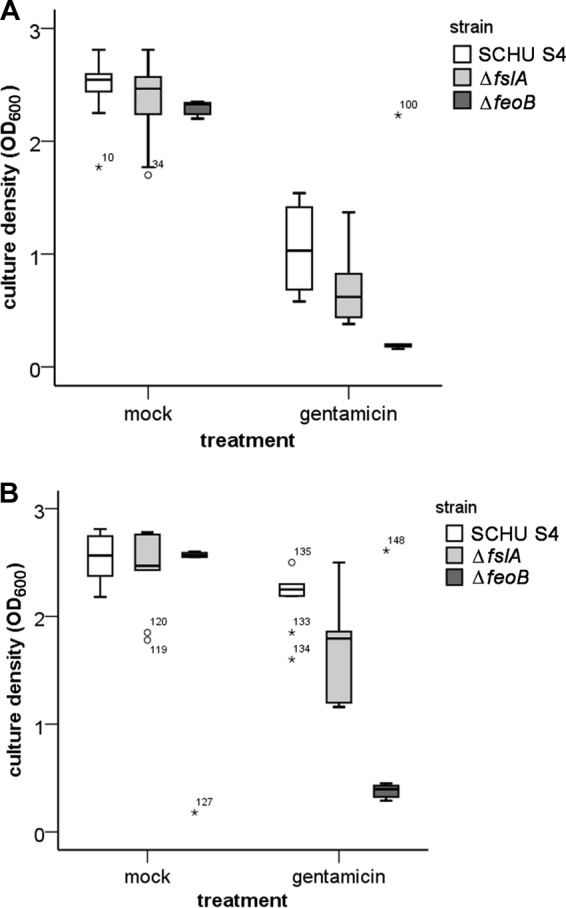
FIG 2.

Gentamicin-induced growth inhibition of iron-depleted SCHU S4 and the ΔfslA and ΔfeoB mutants in CDM supplemented with 2.0 μg/ml FeSO4 (A) or 12 μg/ml FeSO4 (B). After 24 h of growth, the culture density was determined. The box plots represent values from three separate experiments, each with triplicate samples. The circles and asterisks represent mild and extreme outliers, respectively, as determined by SPSS. The numbers next to the circles and asterisks represent arbitrary designations for the individual values.
