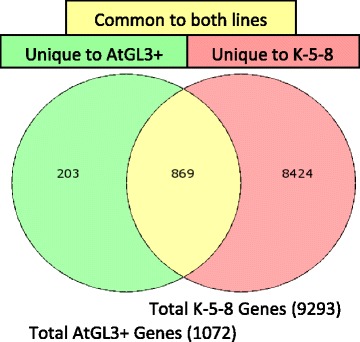
Fig. 6.

Venn diagram representing the total number of differentially expressed genes (DEGs) in first leaves of hairy AtGL3+ B. napus and ultra-hairy K-5-8 relative to semi-glabrous B. napus cv. Westar leaves. Number within the over-lapping region represents the number of DEGs with differential expression common to the two trichome-enhanced leaf samples. The non-overlapping regions show the number of DEGs unique to each sample
