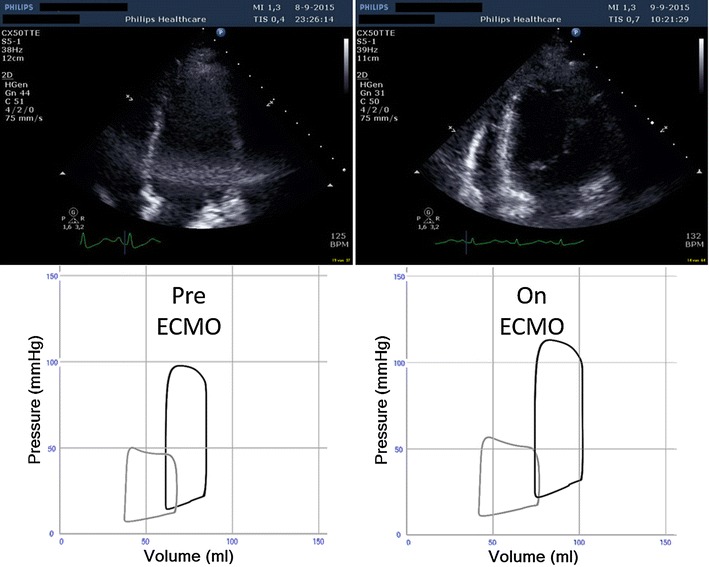
Fig. 2.

Comparison of end-diastolic transthoracic echocardiograms in upper panel shows dilatation of the left ventricle after initiation of VA ECMO (right) as compared to baseline before initiation of VA ECMO (left). The lower panel shows simulated left (black) and right (gray) ventricular pressure–volume loops before (left lower) and after adjustment of heart rate, systemic vascular resistance and absence of tricuspid regurgitation (right lower) in accordance with available clinical data
