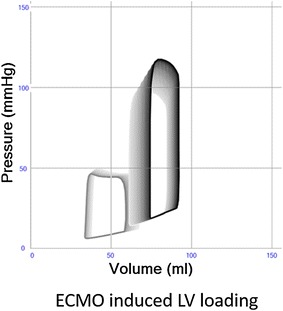
Fig. 3.

Effects of simulated increase of VA-ECMO from 0 to 2.1 L/min left (black) and right (gray) ventricular pressure–volume loops. All other model parameters such as cardiac contractility, intravascular blood volume, systemic and pulmonary vascular resistance are unchanged. The results indicate an increase in left ventricular loading, that is represented by movement of loops upward (higher pressures) and rightward (higher volumes)
