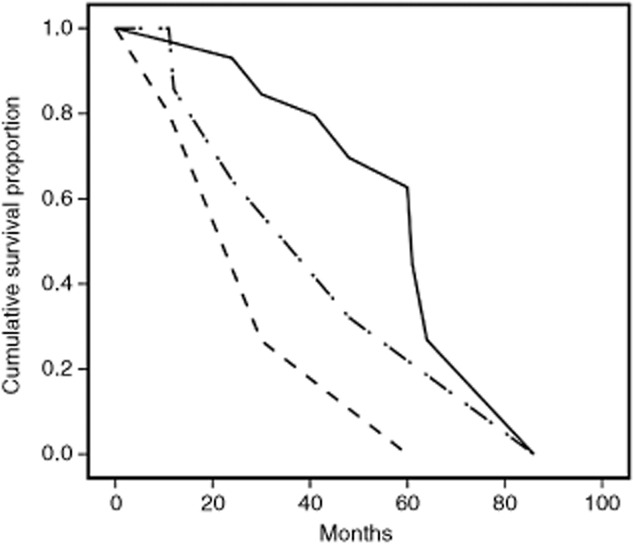
Figure 2.

Kaplan-Meier analysis of overall survival according to modified Glasgow prognostic score m(GPS). Life-tables from year one to five are as follows: mGPS = 0 (continuous line): 97%, 97%, 85%, 80%, 69%; number at risk: 32, 28, 24, 18, 14; censored: 0, 6, 2, 3, 4. mGPS = 1 (dashed line): 100%, 83%, 63%, 63%, 31%; number at risk: 7, 6, 4, 2.5, 2; censored: 0, 2, 0, 1, 0. mGPS = 2 (dash-dot line): 84%, 80%, 27%, 27%, 0%; number at risk: 5, 3.5, 3, 1, 1; censored: 0, 1, 0, 0, 0.
